Journey Mapping
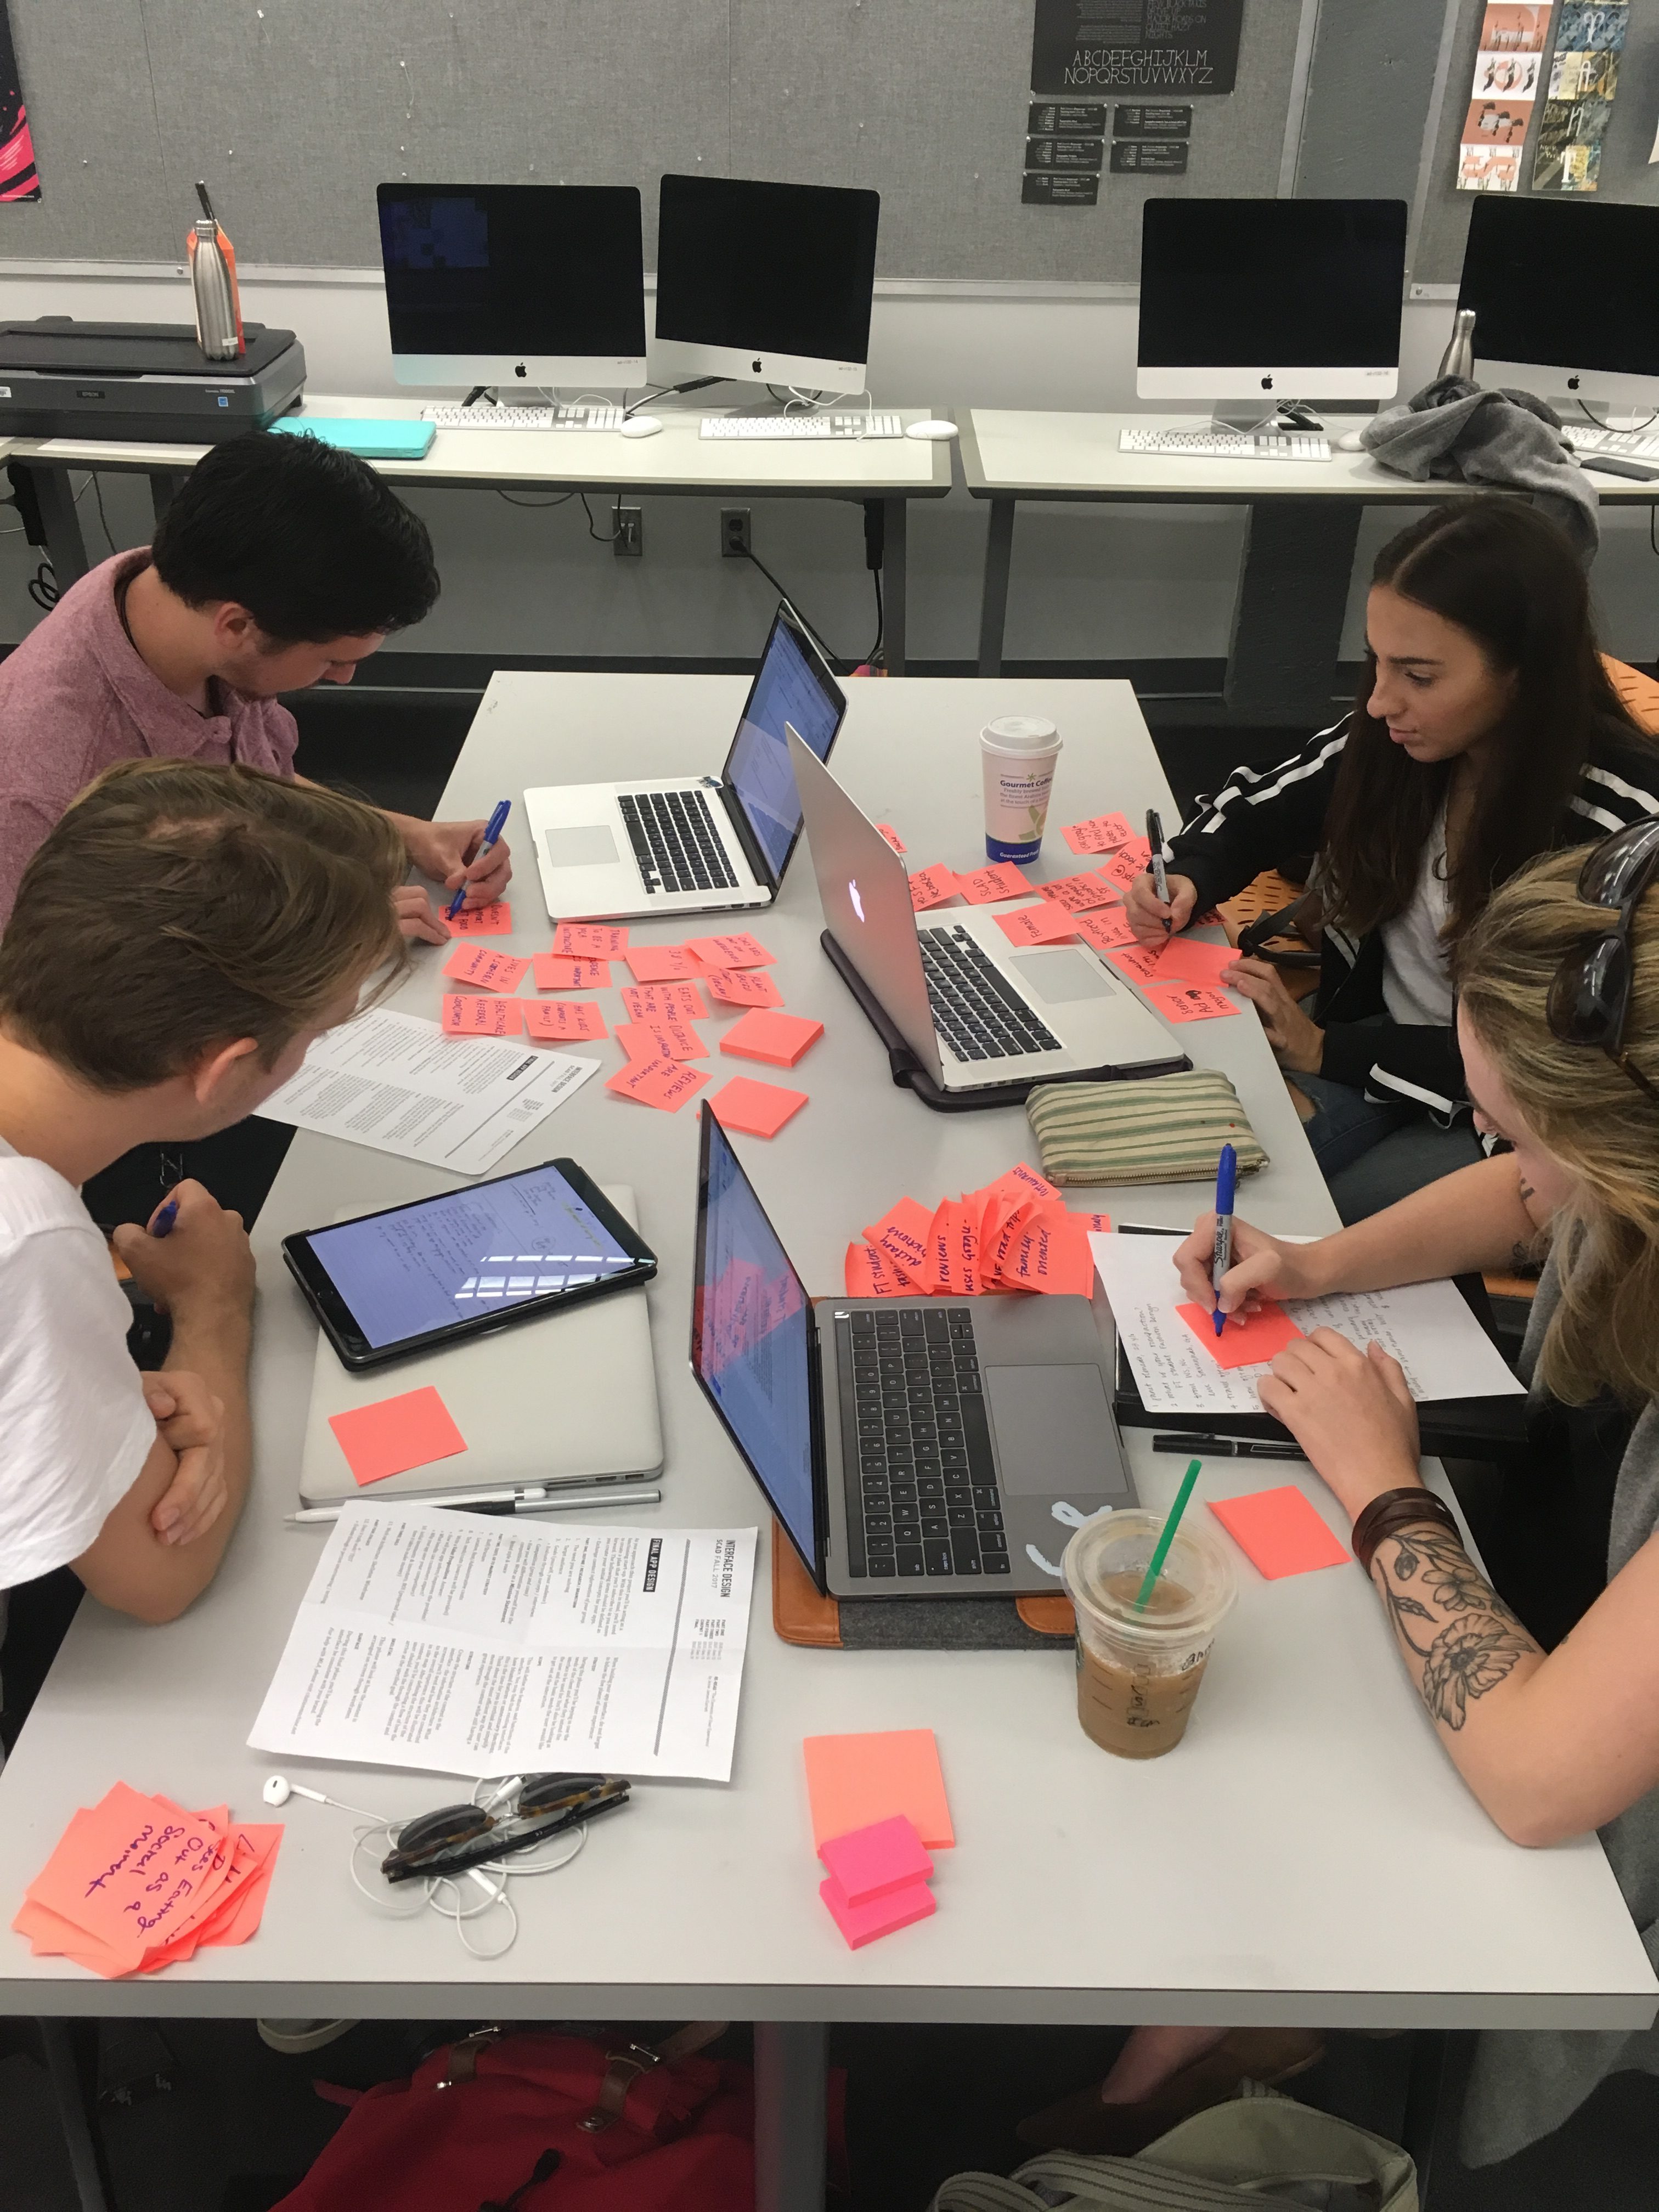
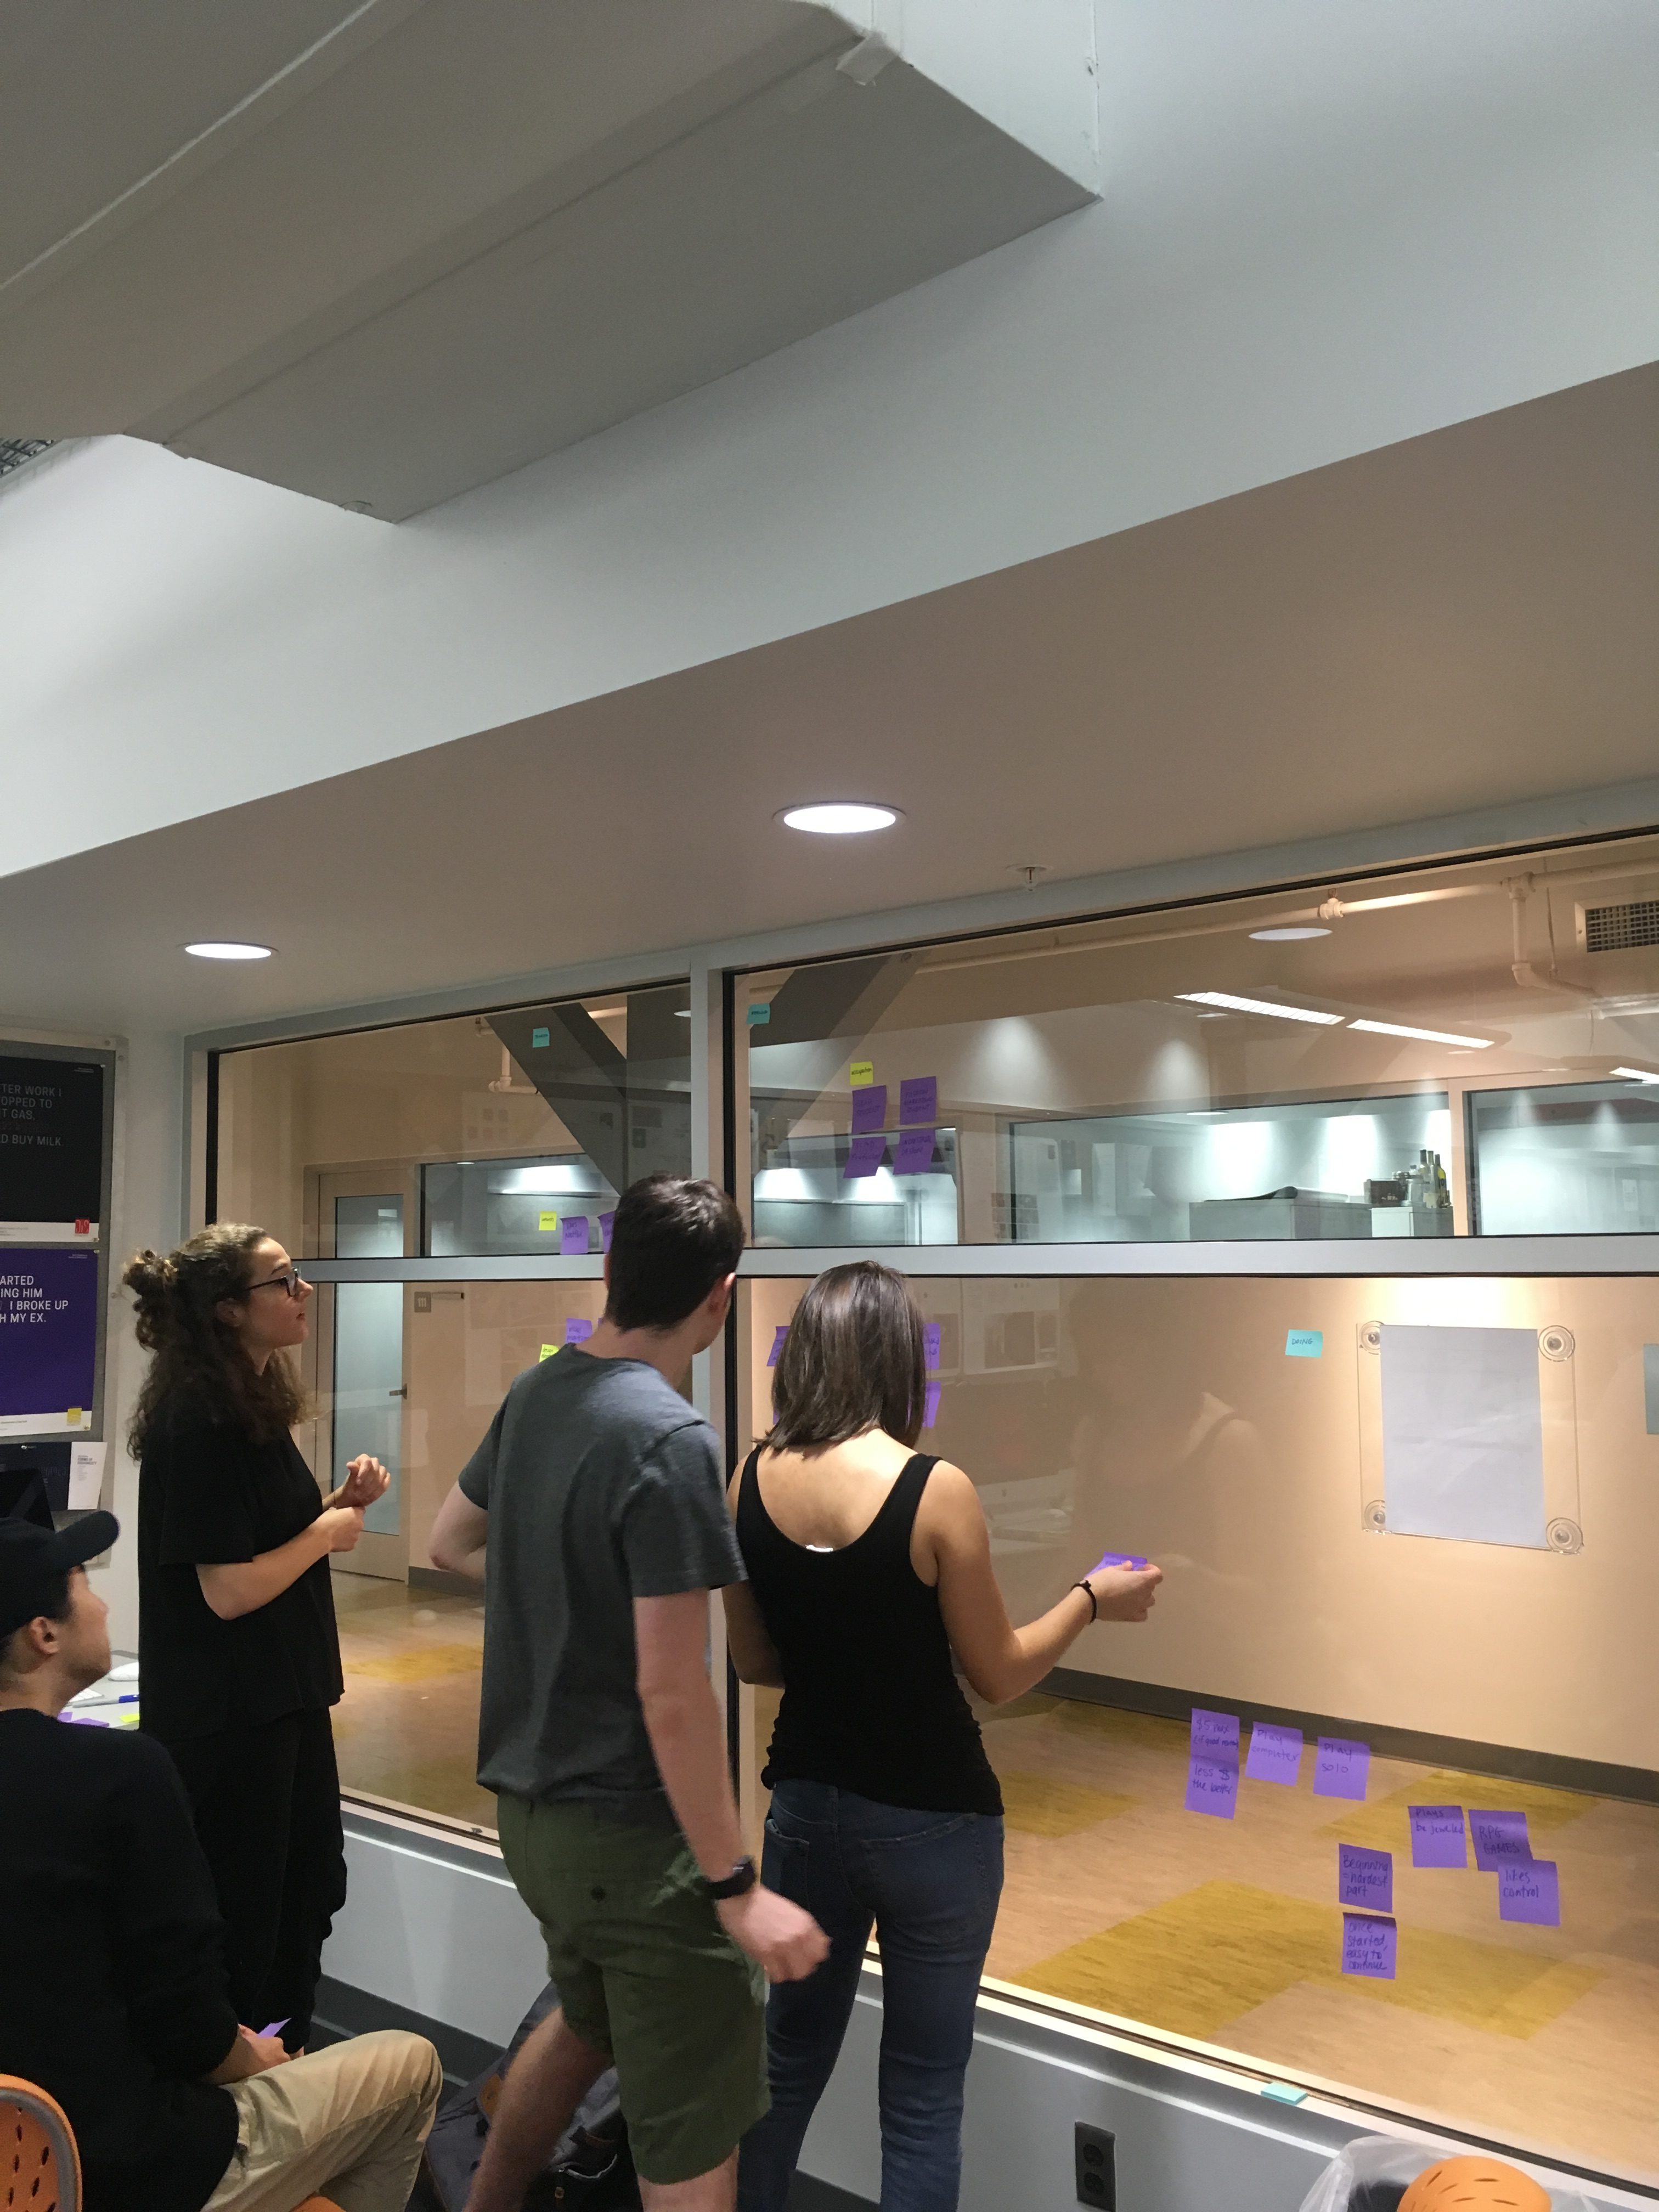
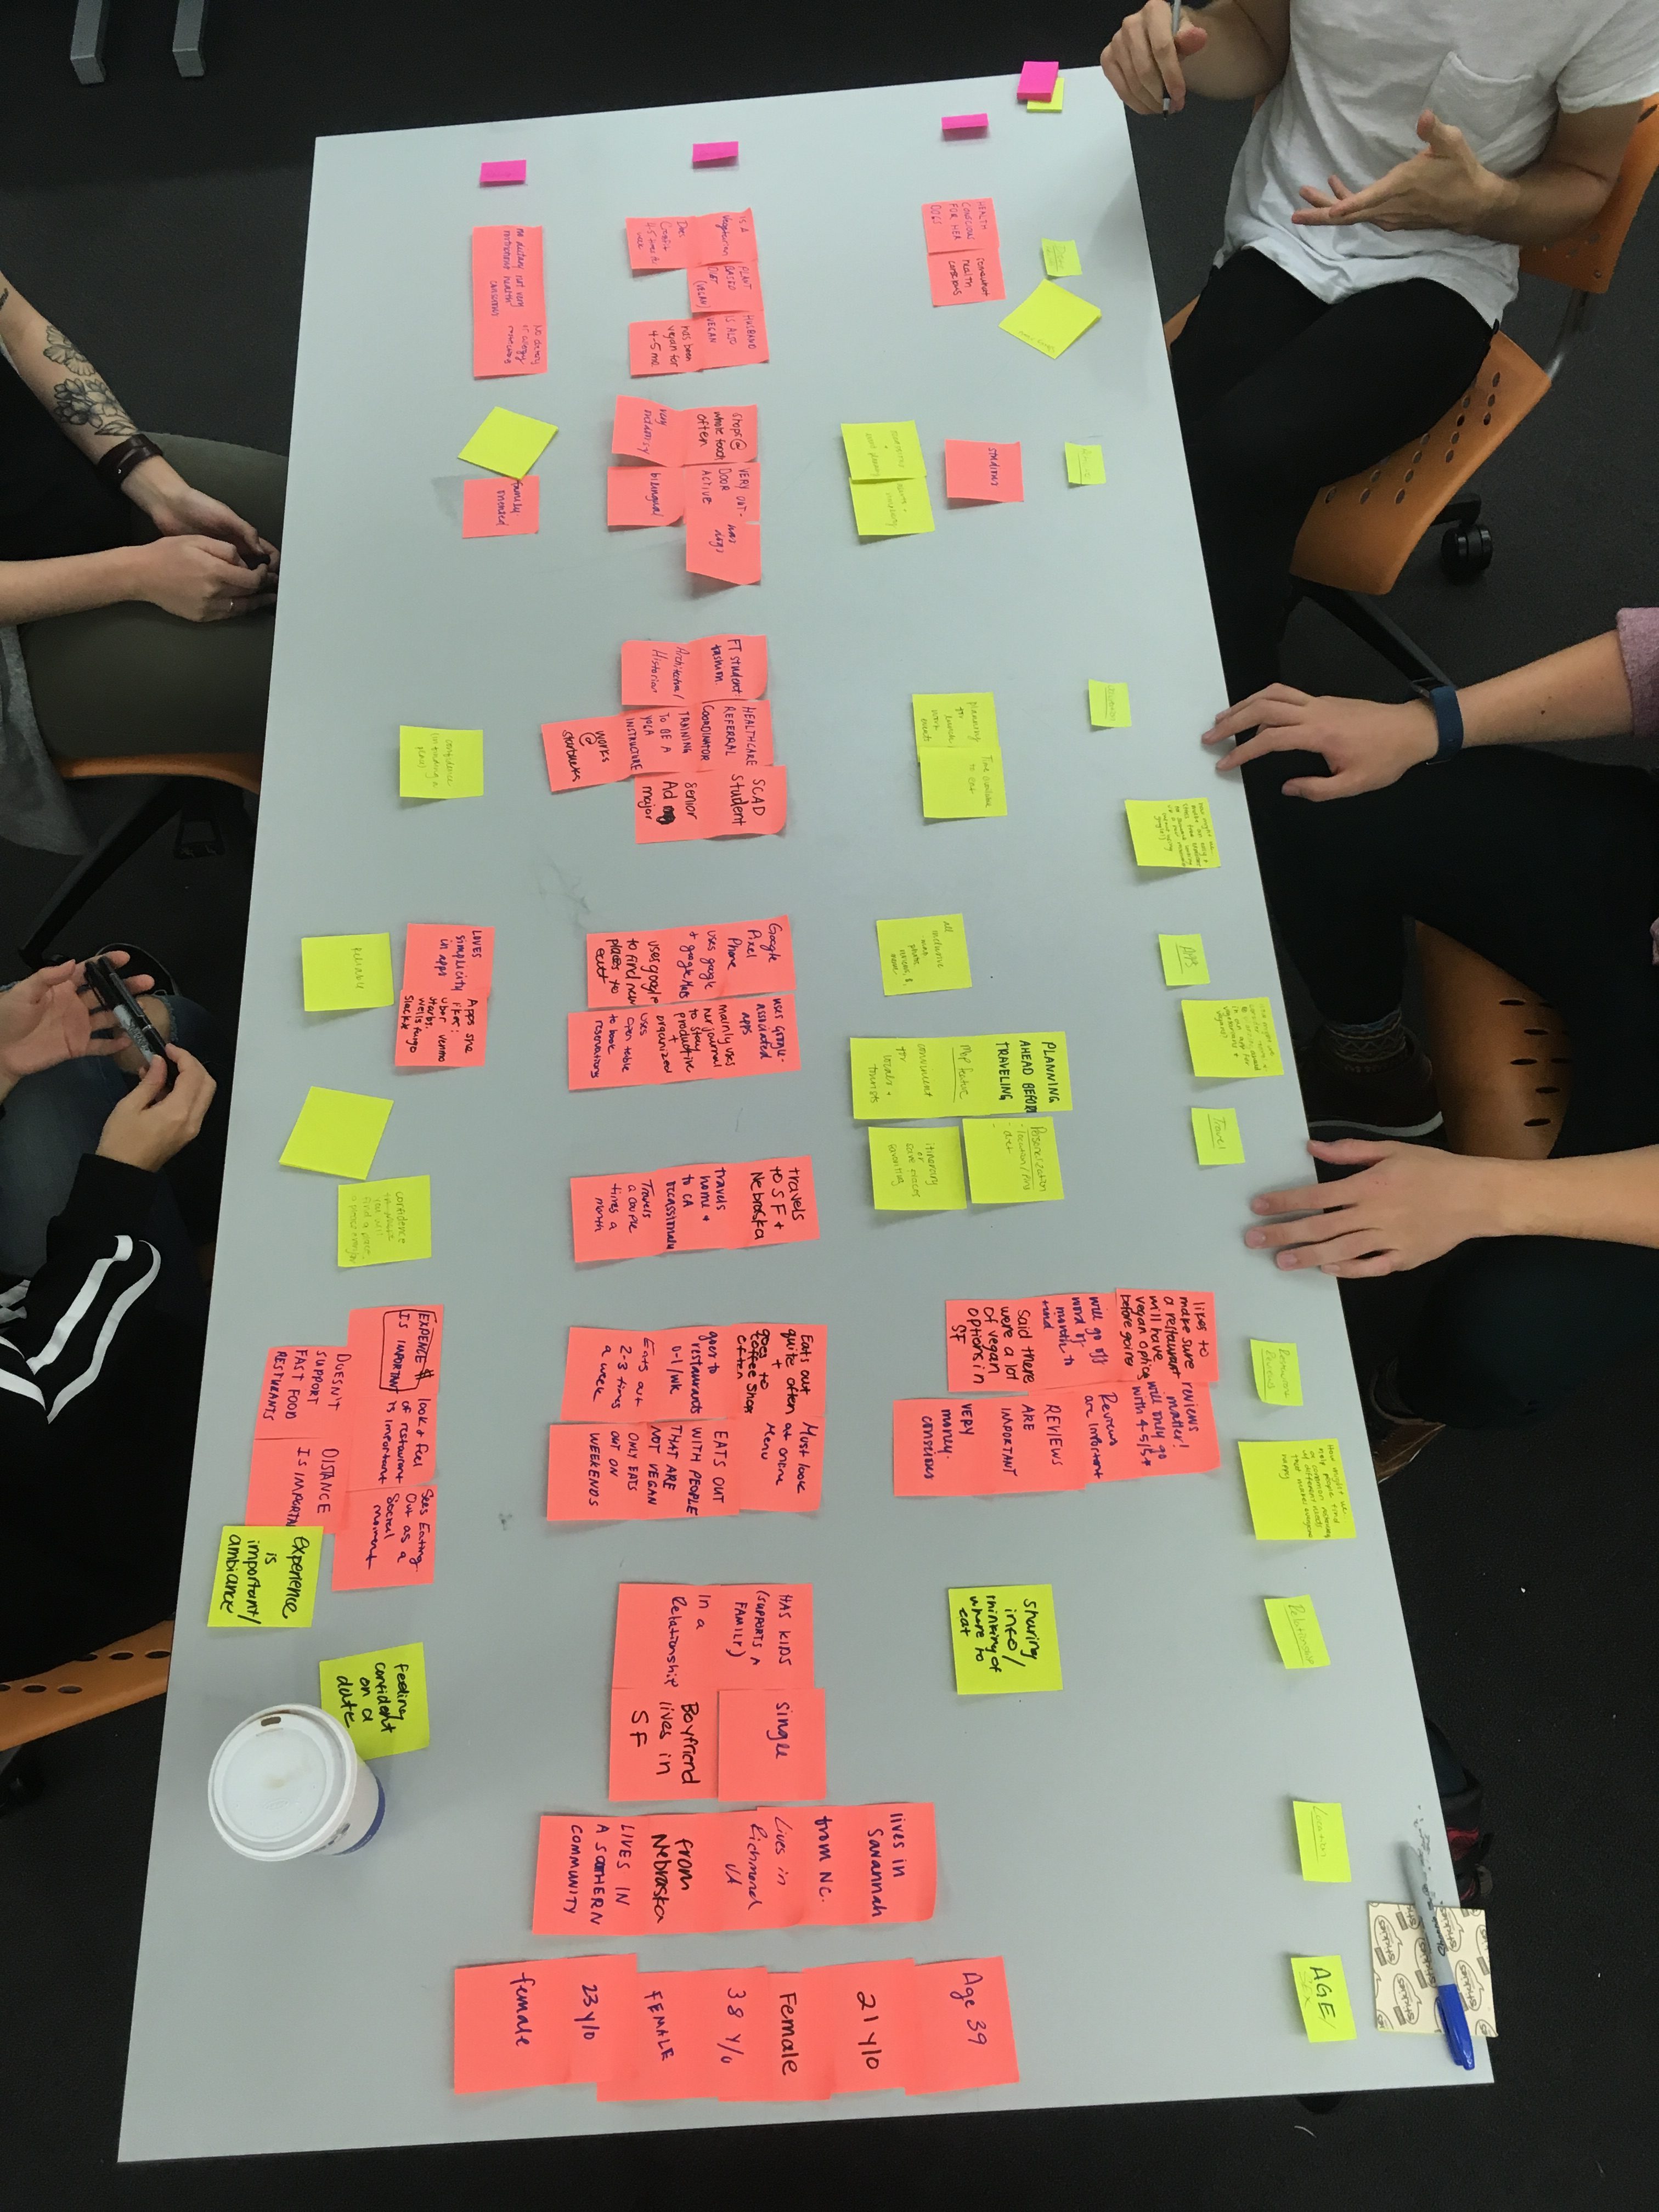
To practise synthesising and analysing research for the final exercise, we conducted a speed journey mapping exercise. After assembling into their groups and discussing the interviews they conducted over the weekend, everyone wrote down their information on post-its of one color, such that each data point had its own individual post-it (e.g. age of the interviewee, body language, how the interviewee felt about a certain service and their occupation are all unique data points)
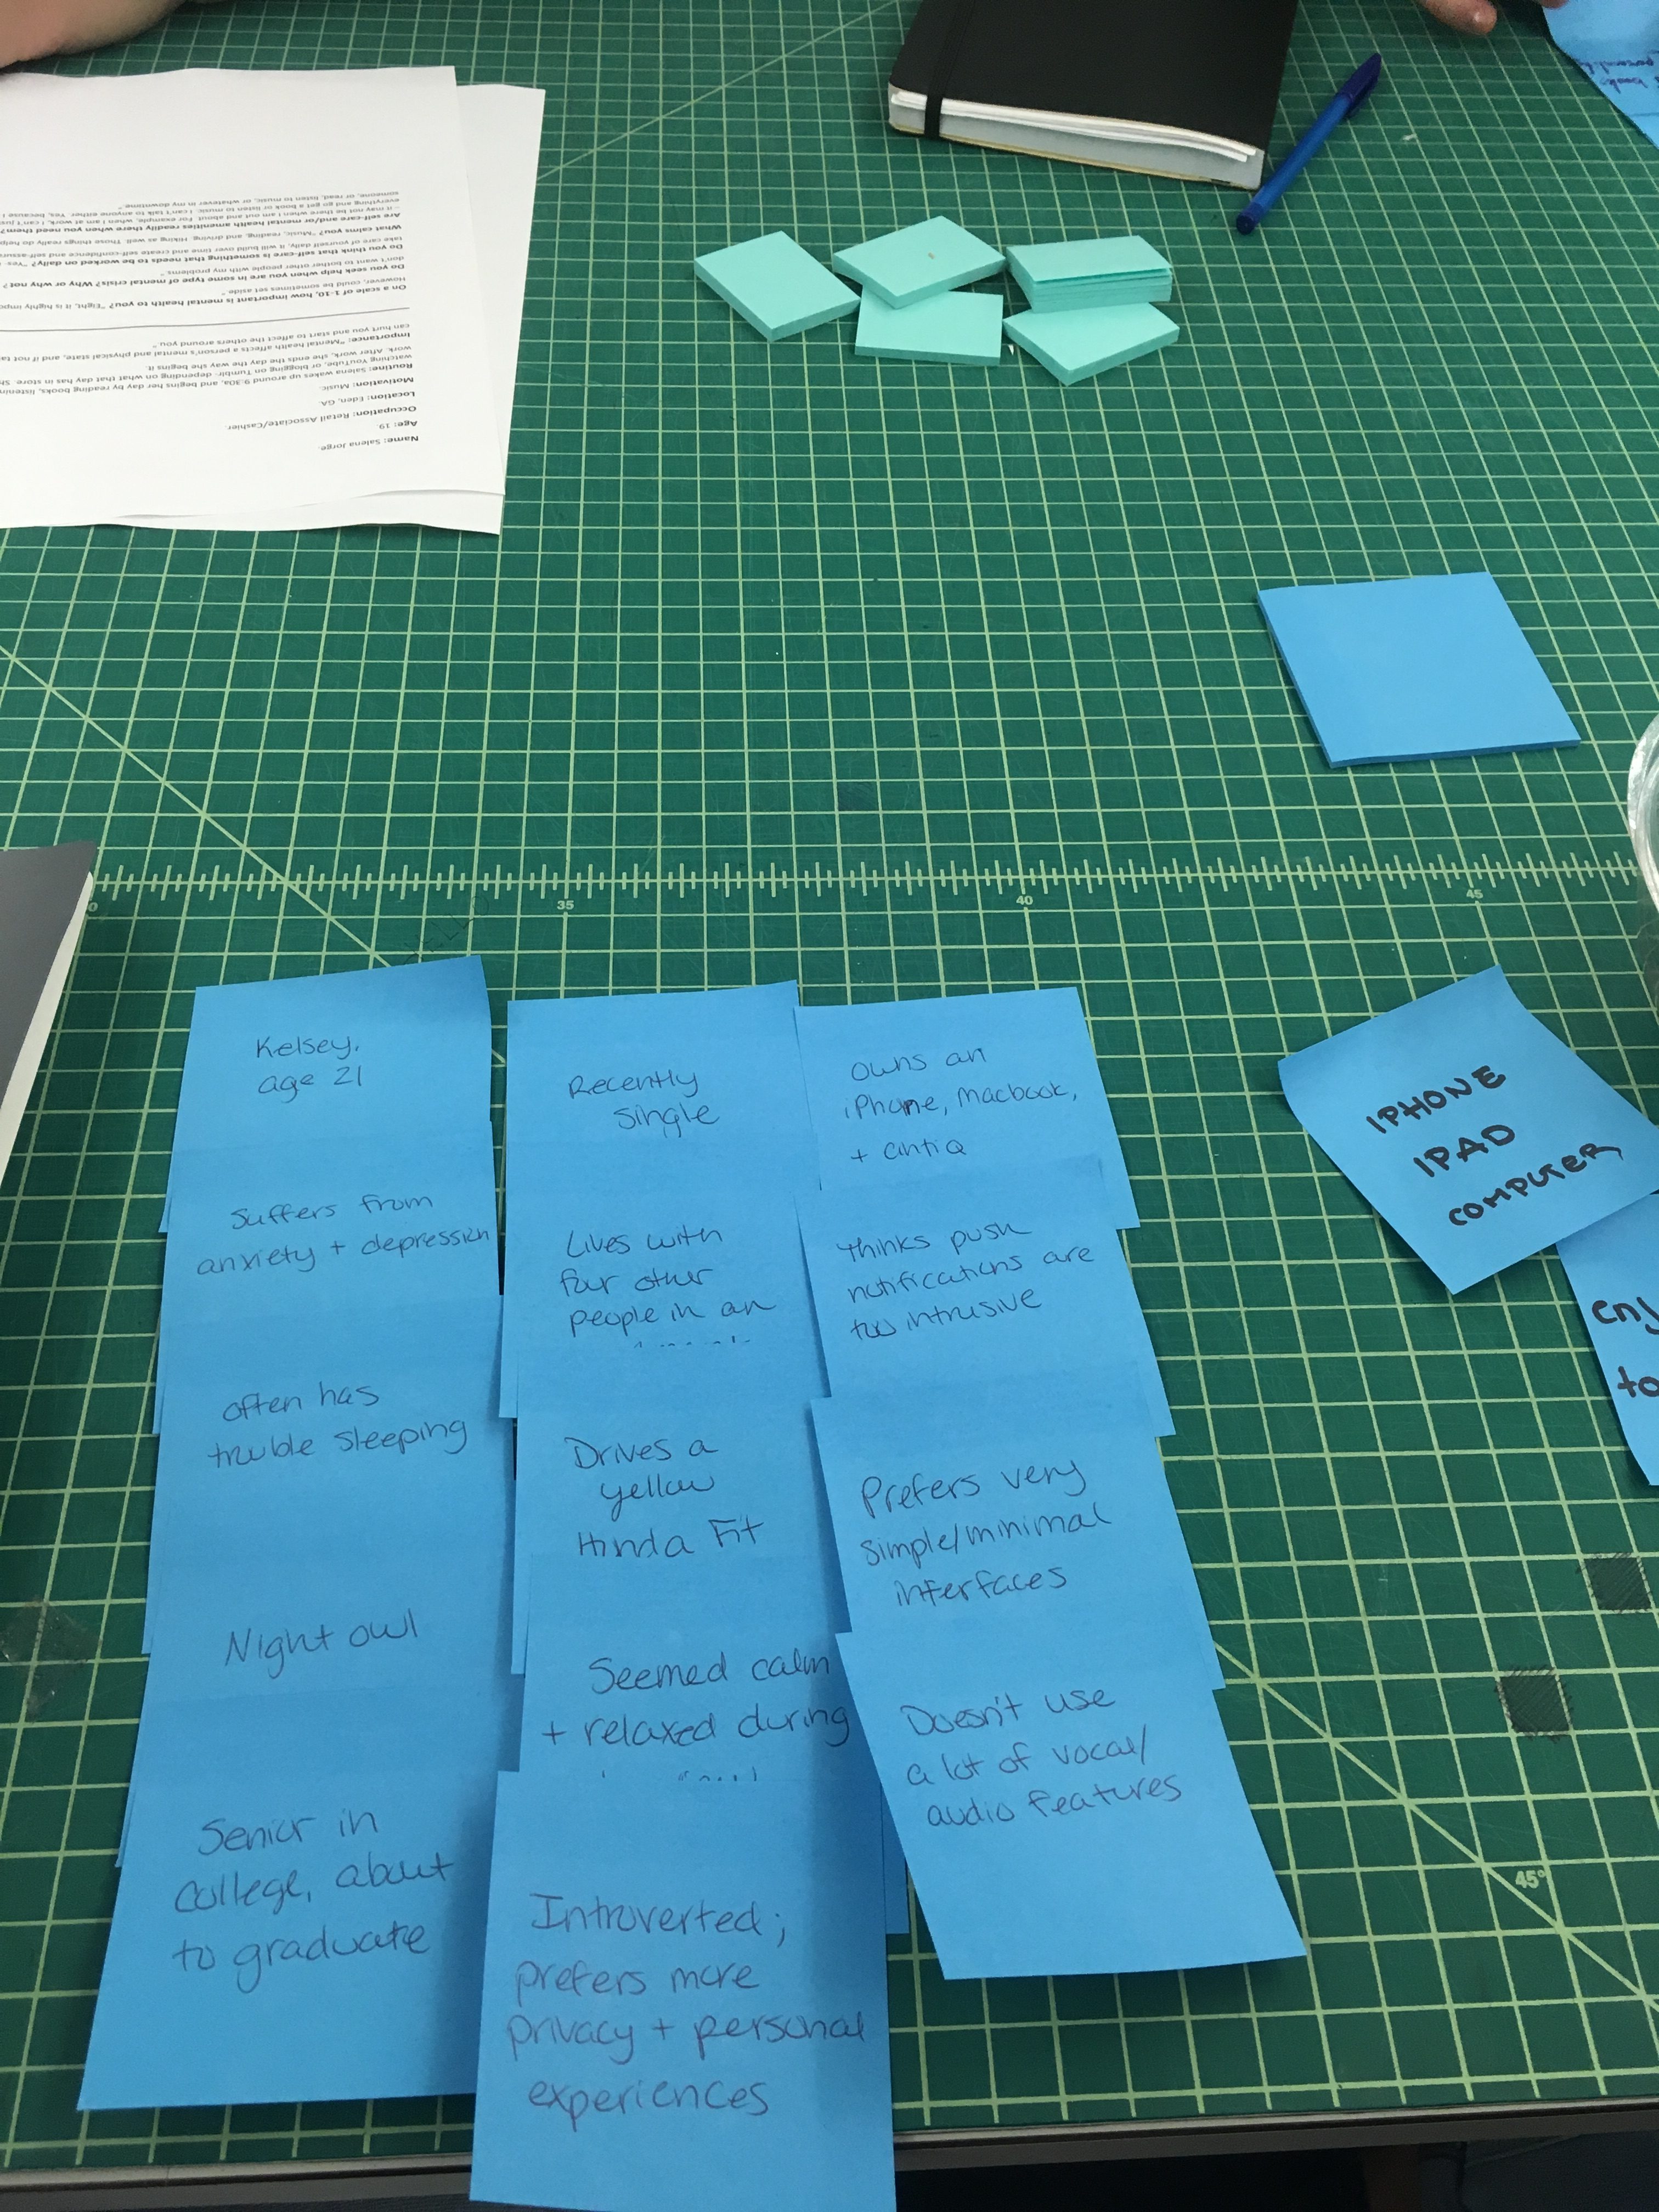
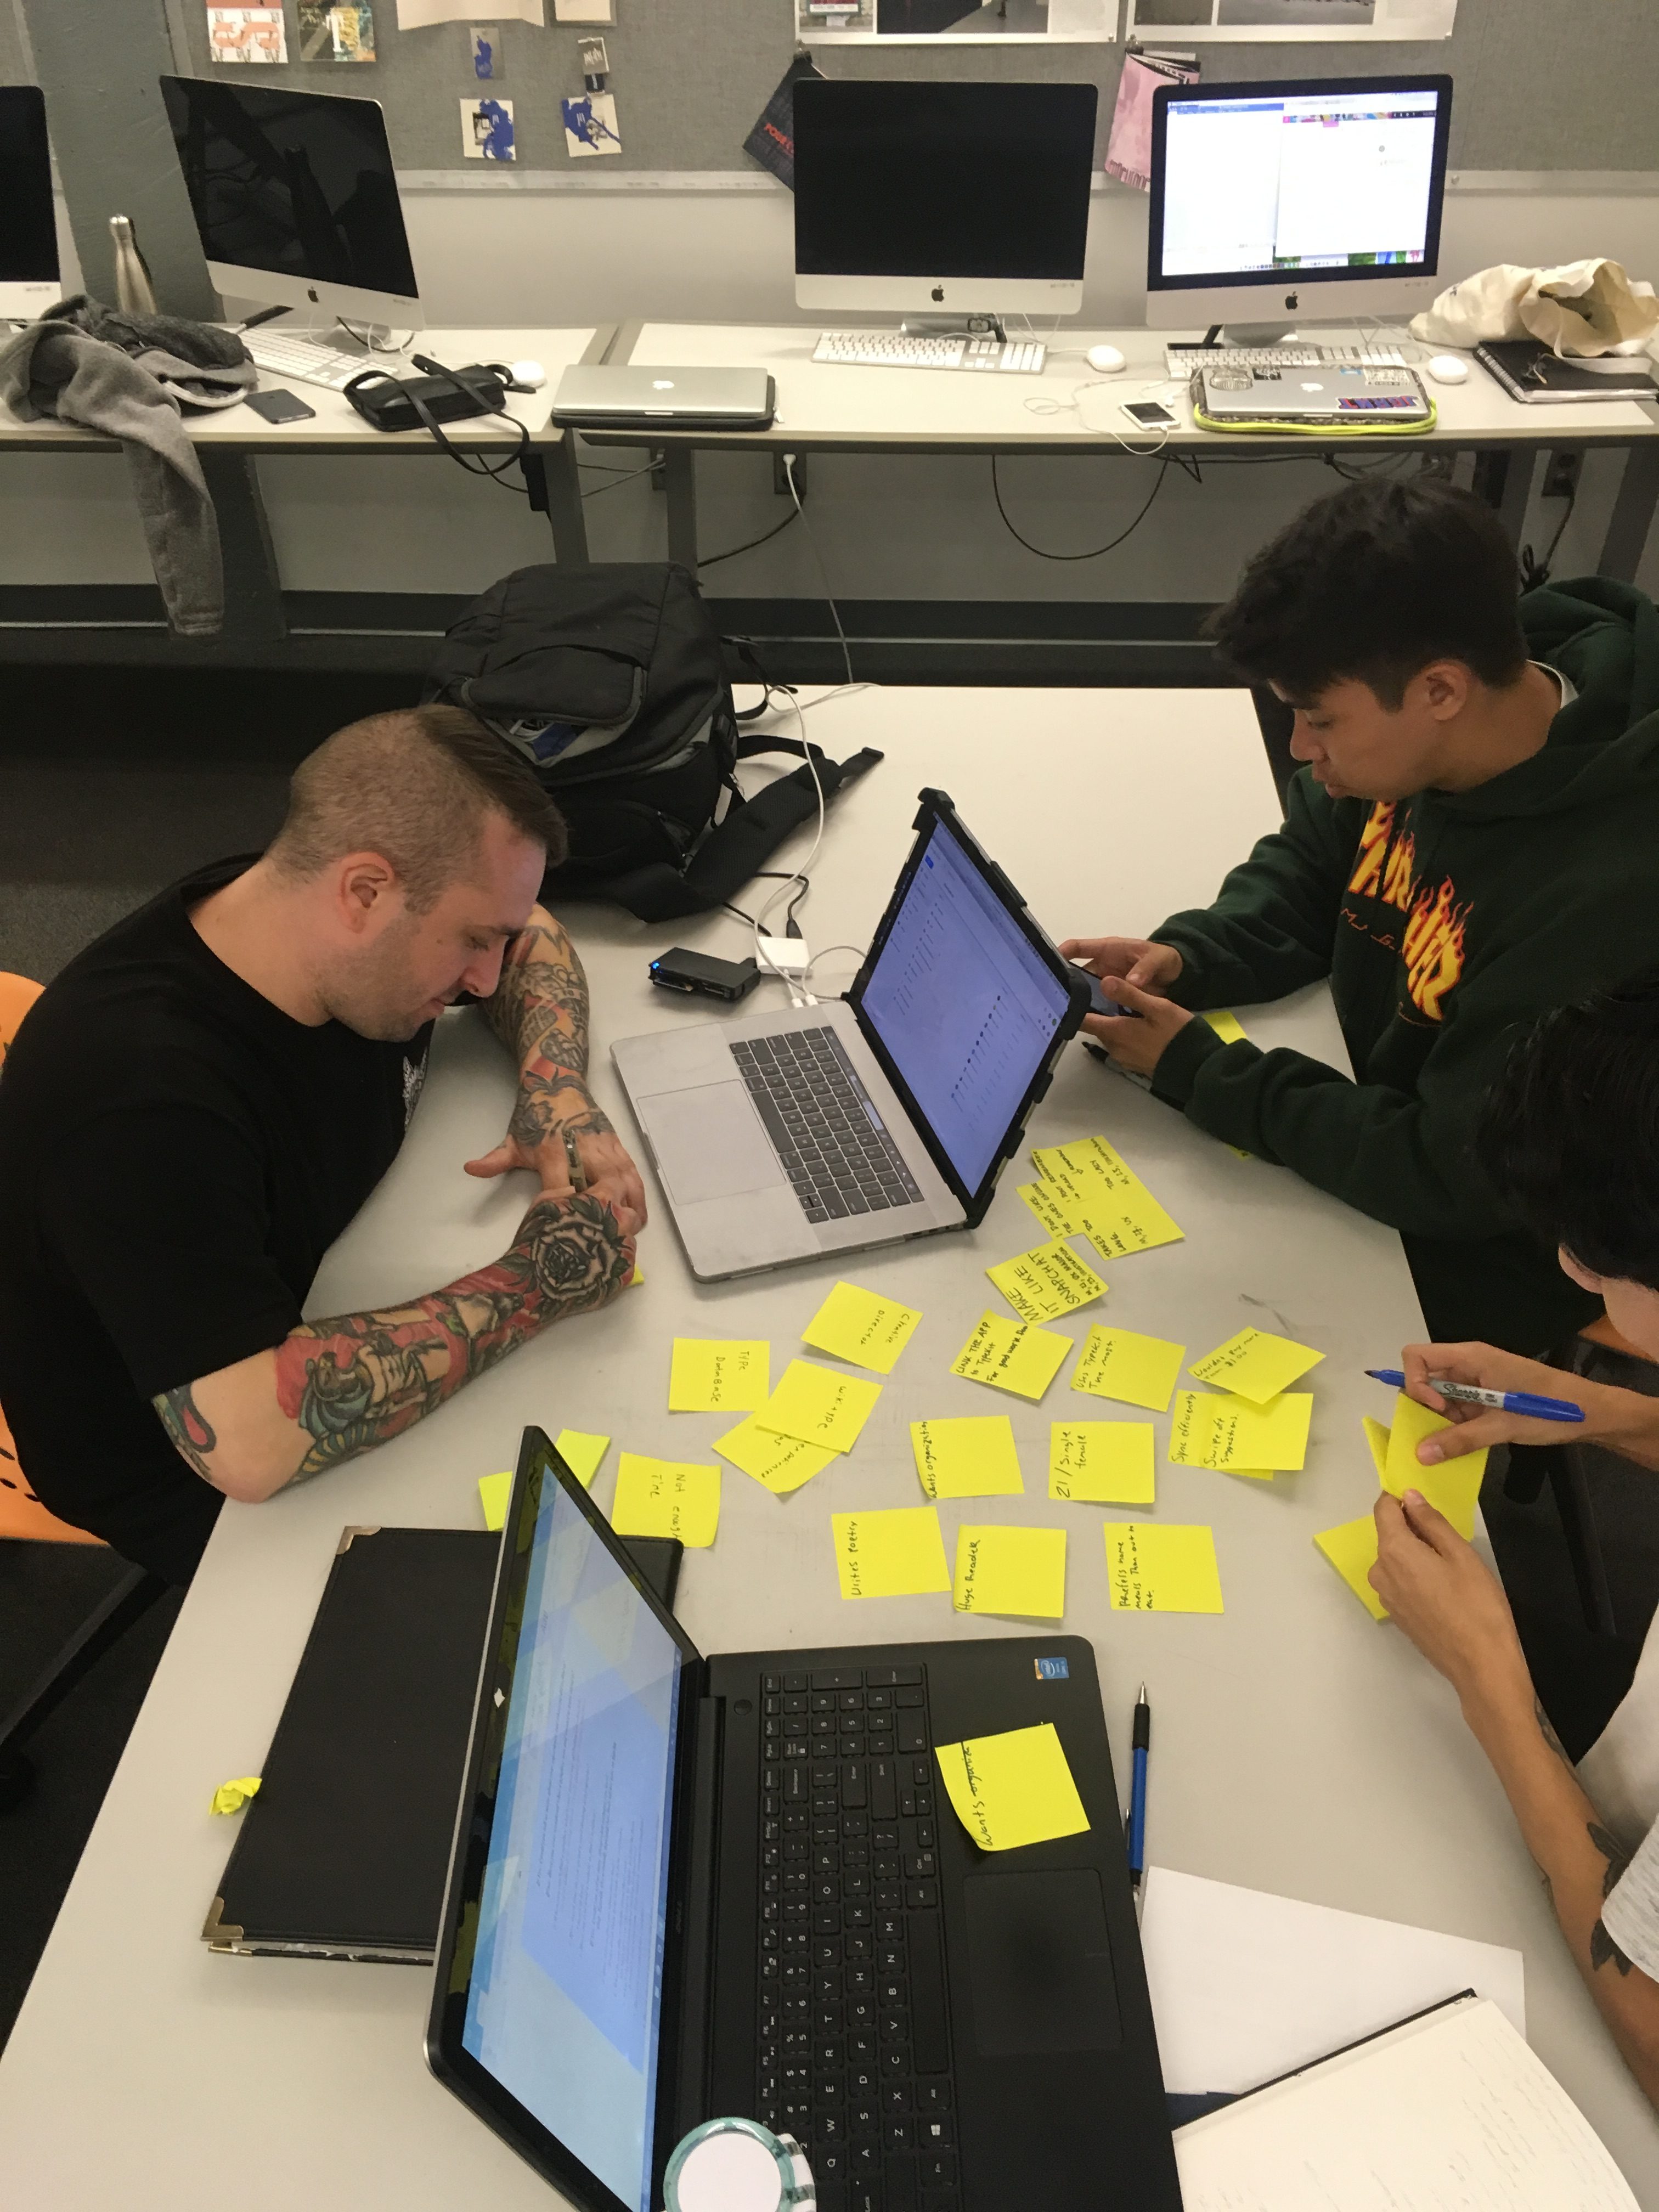
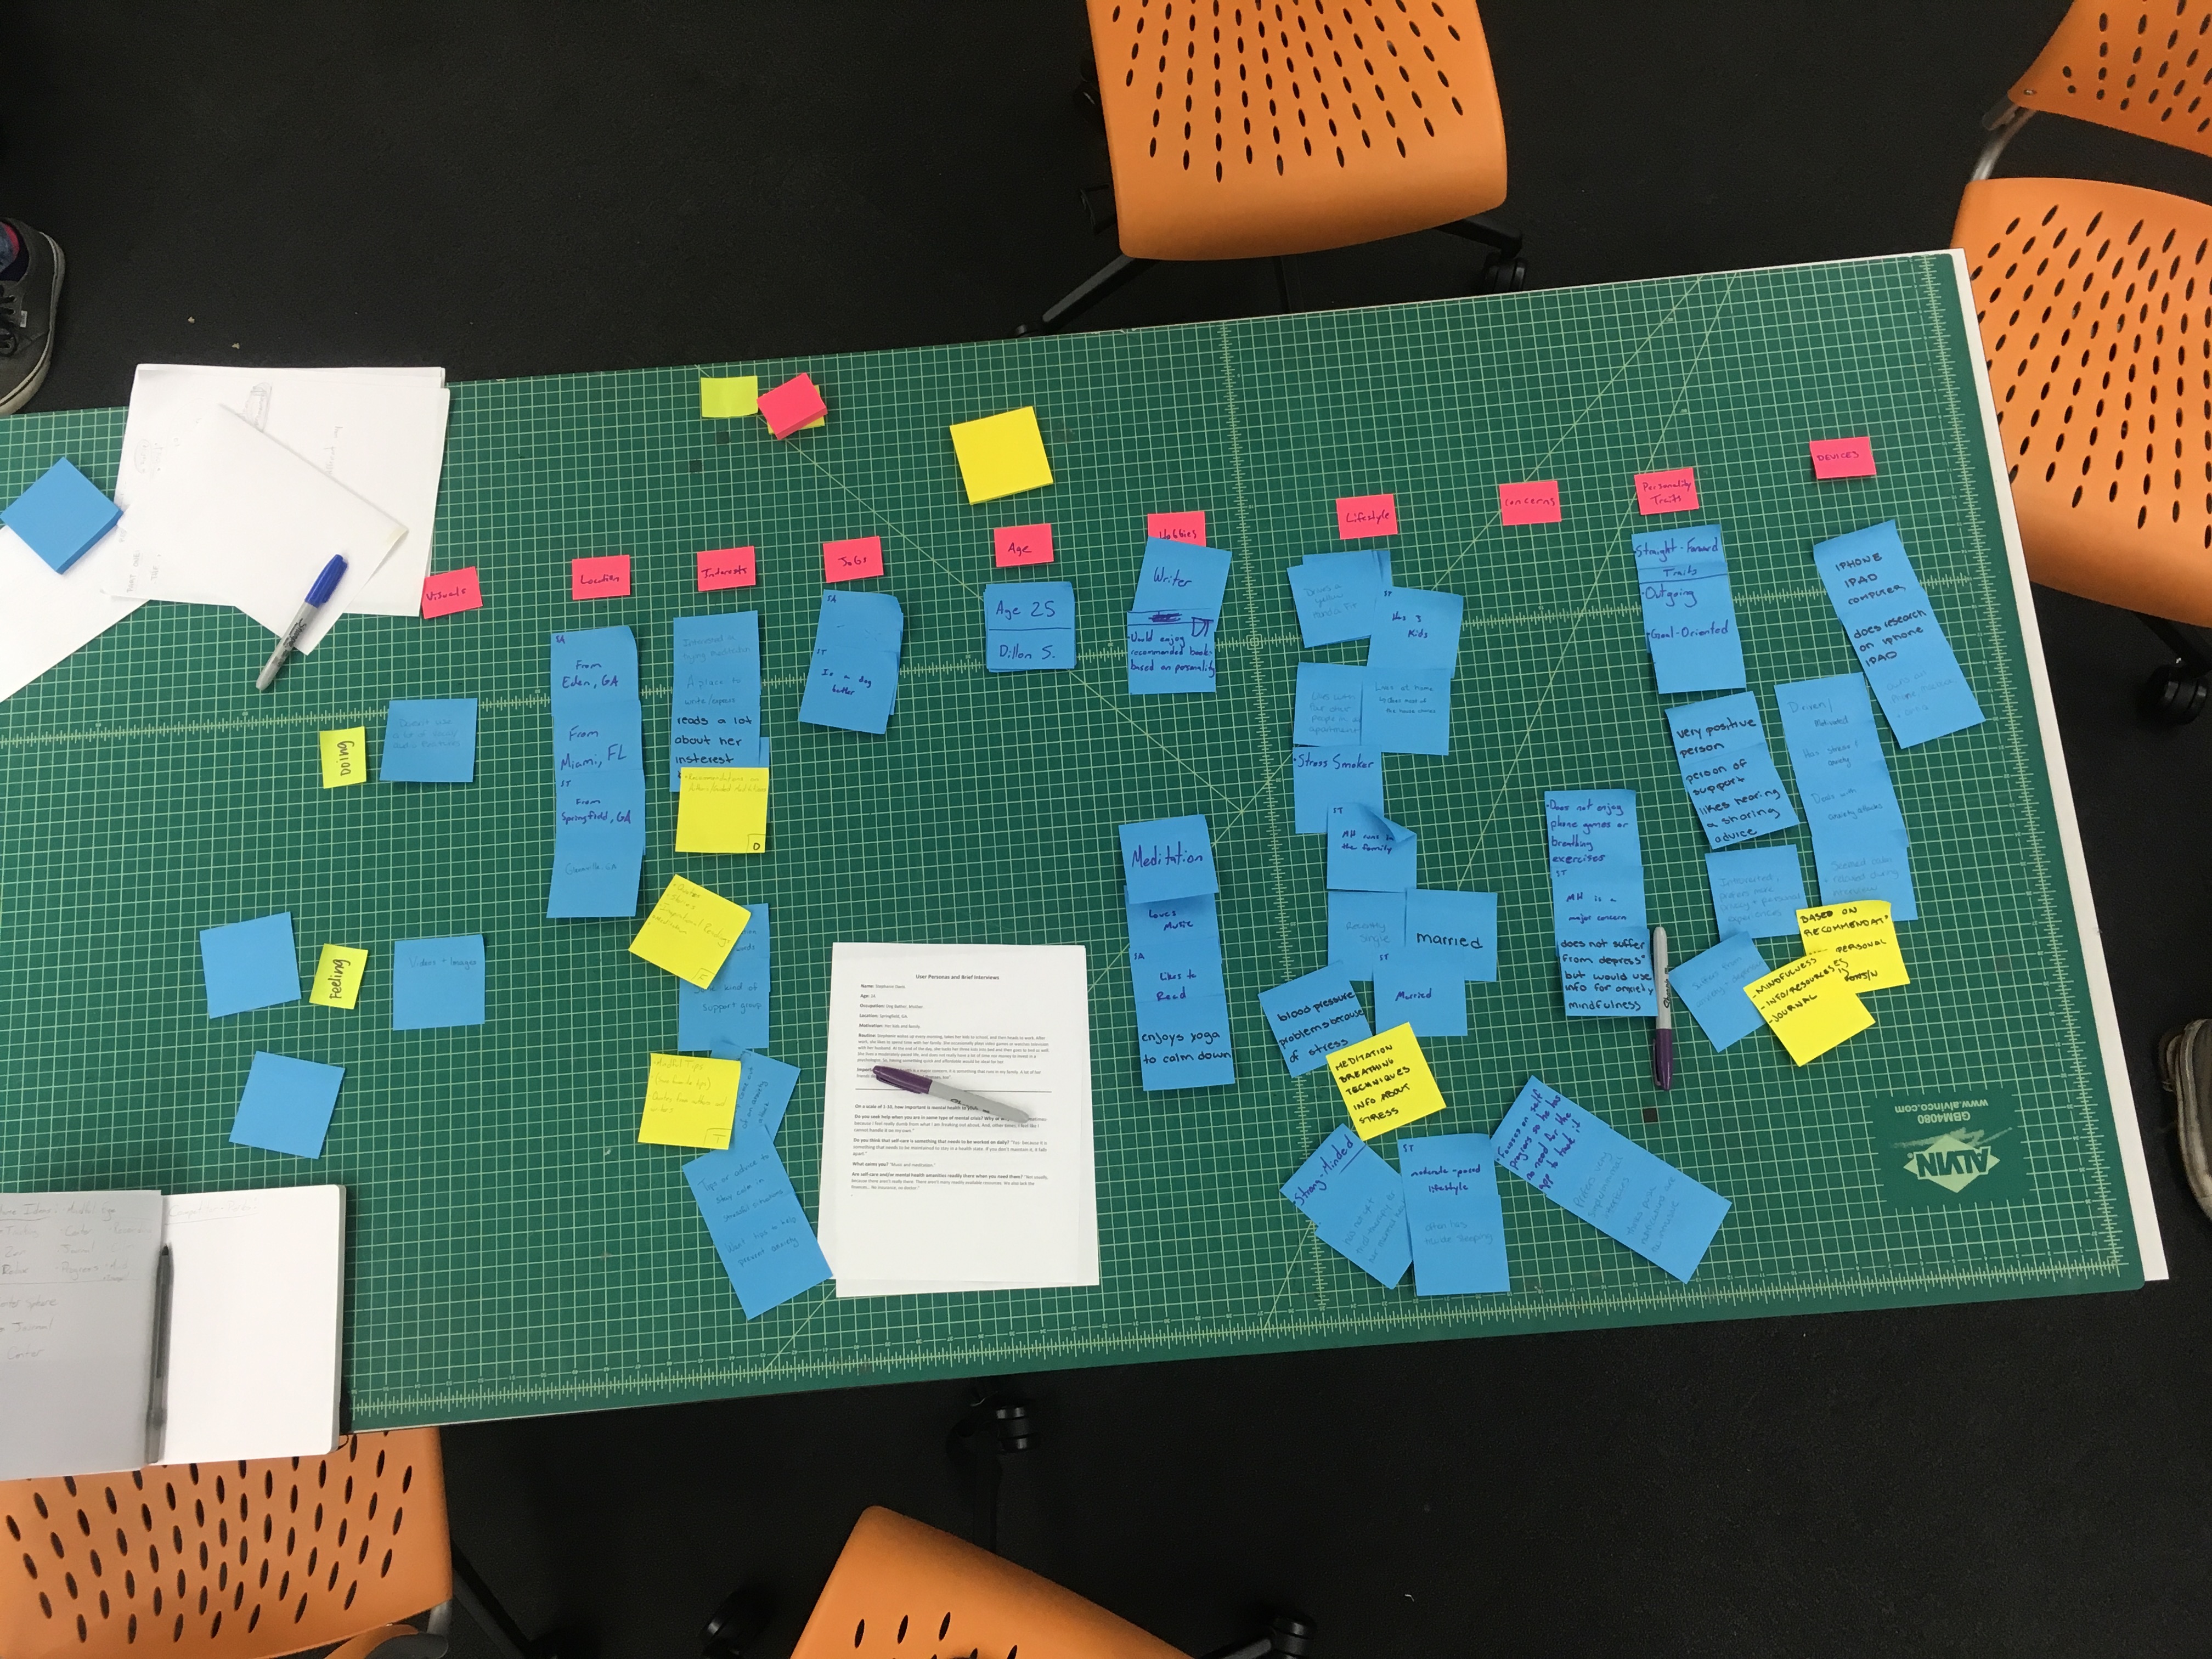
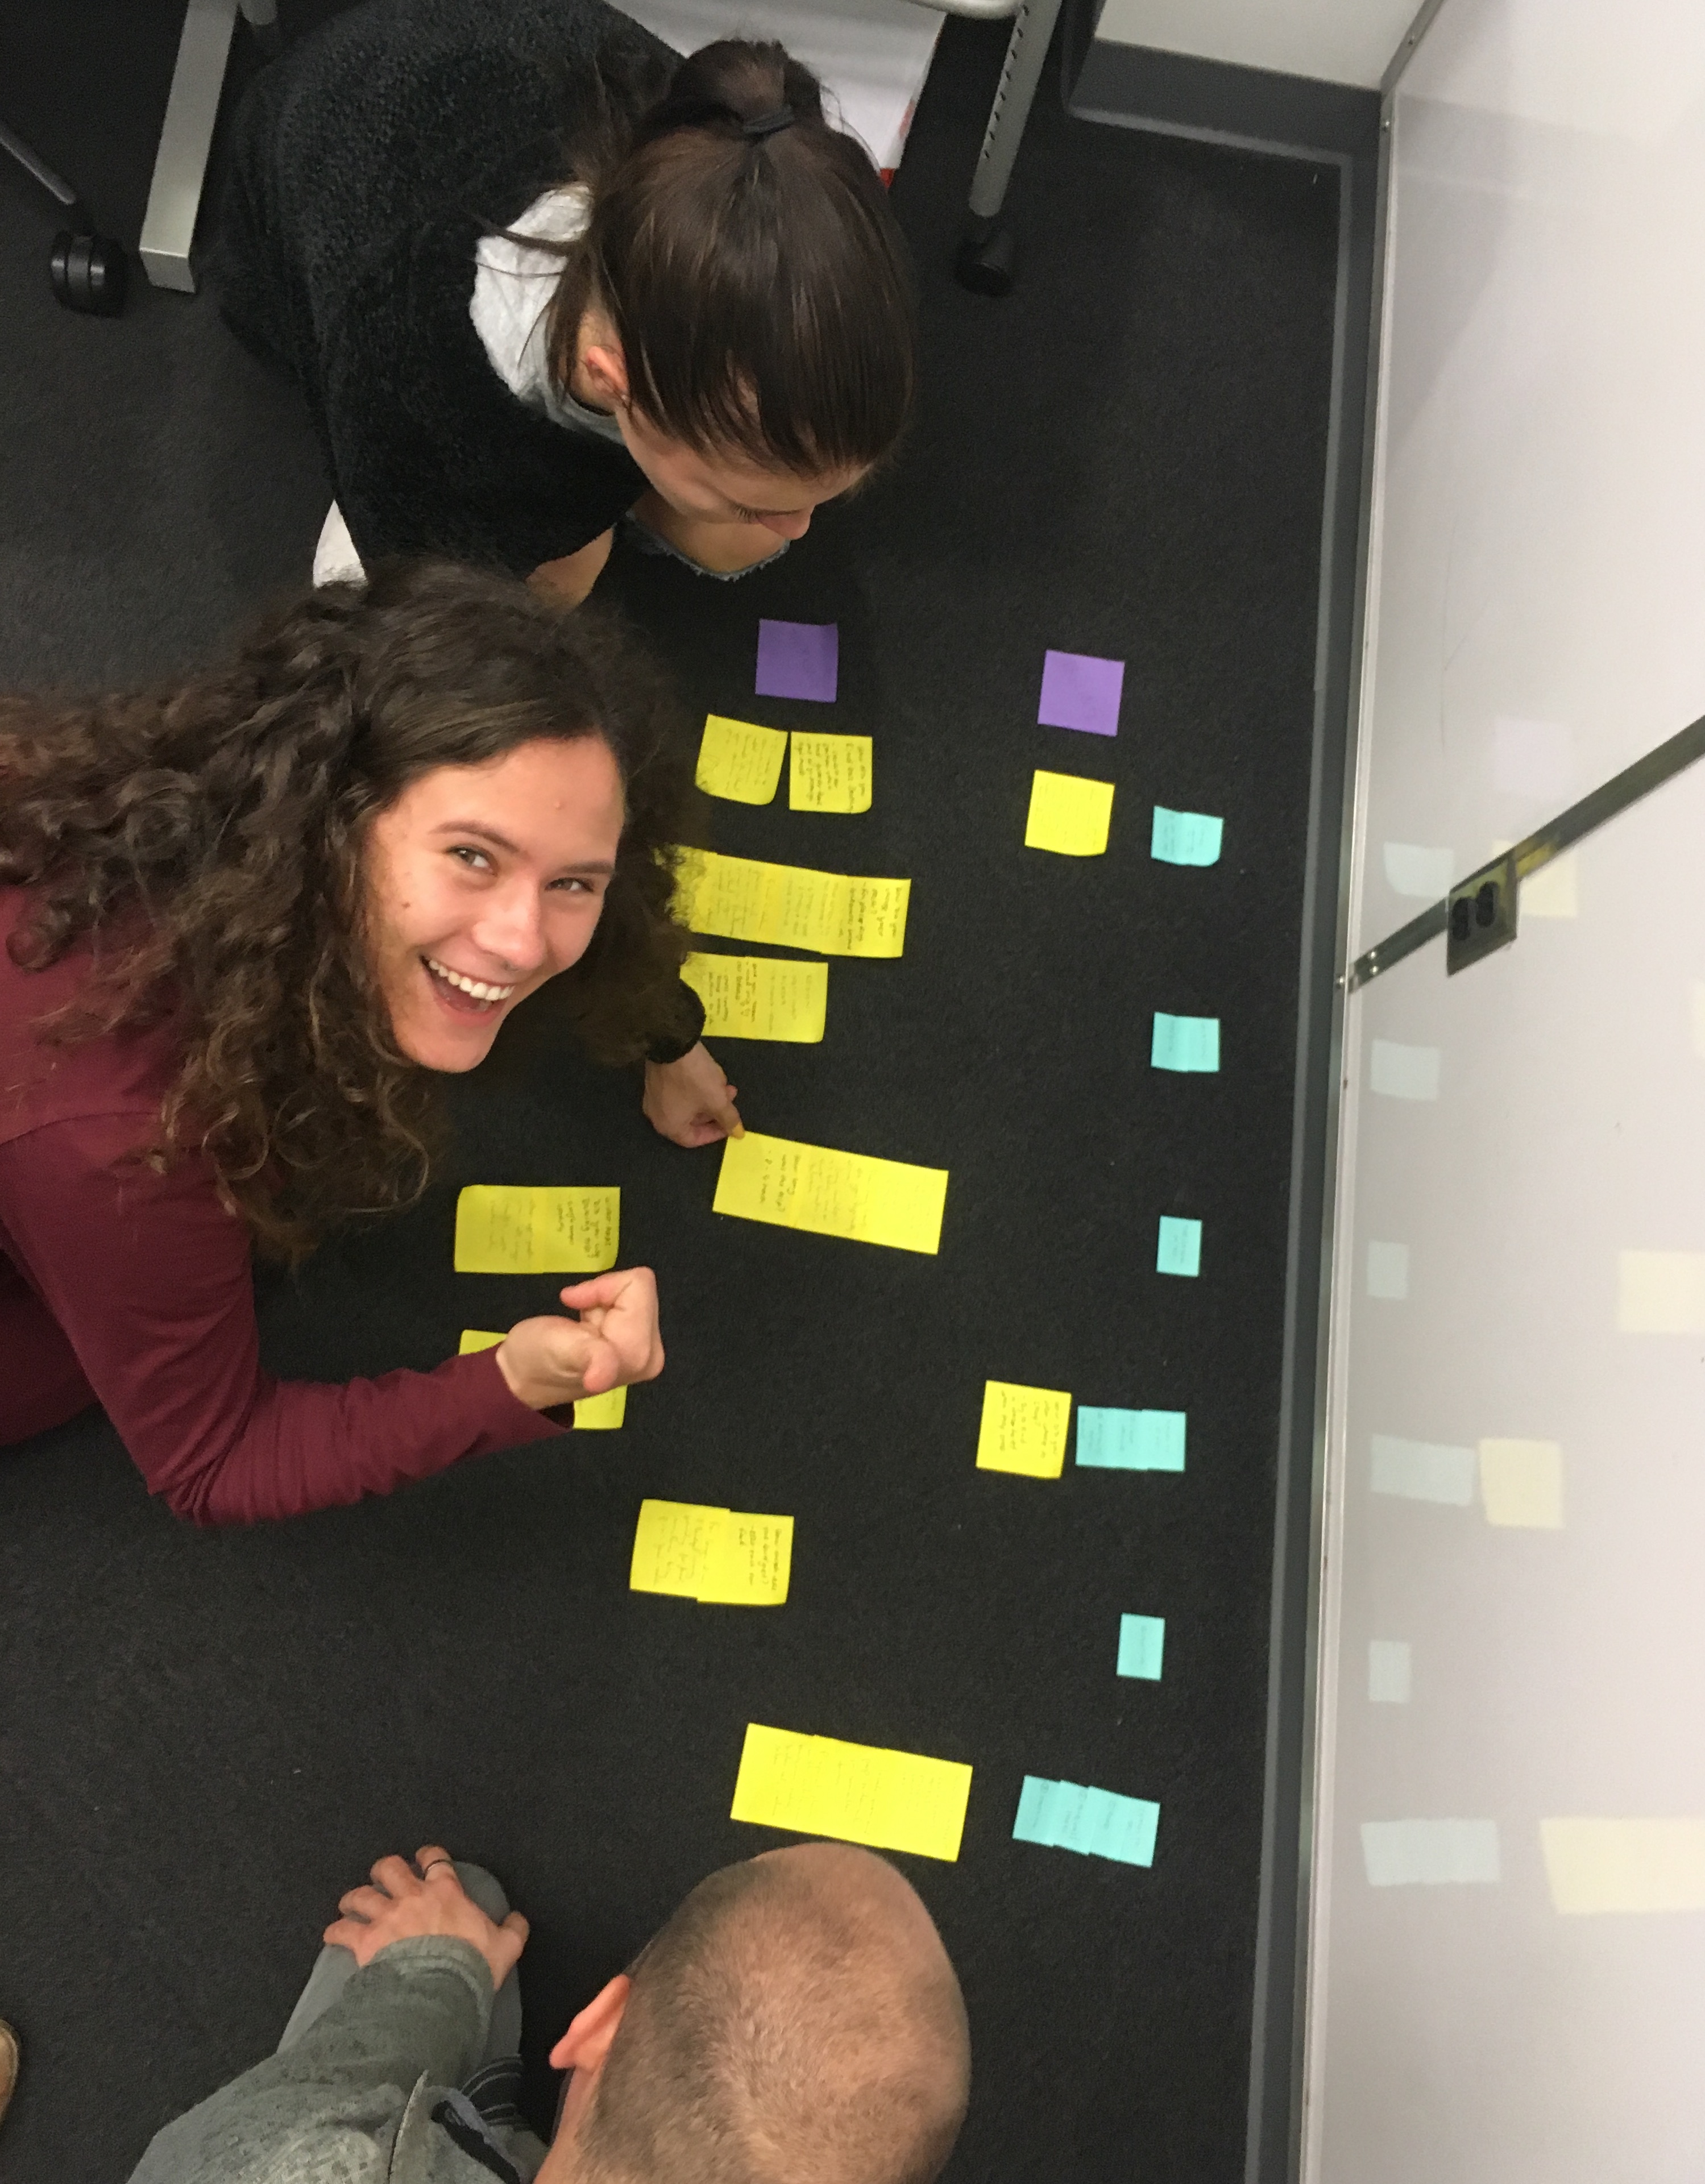
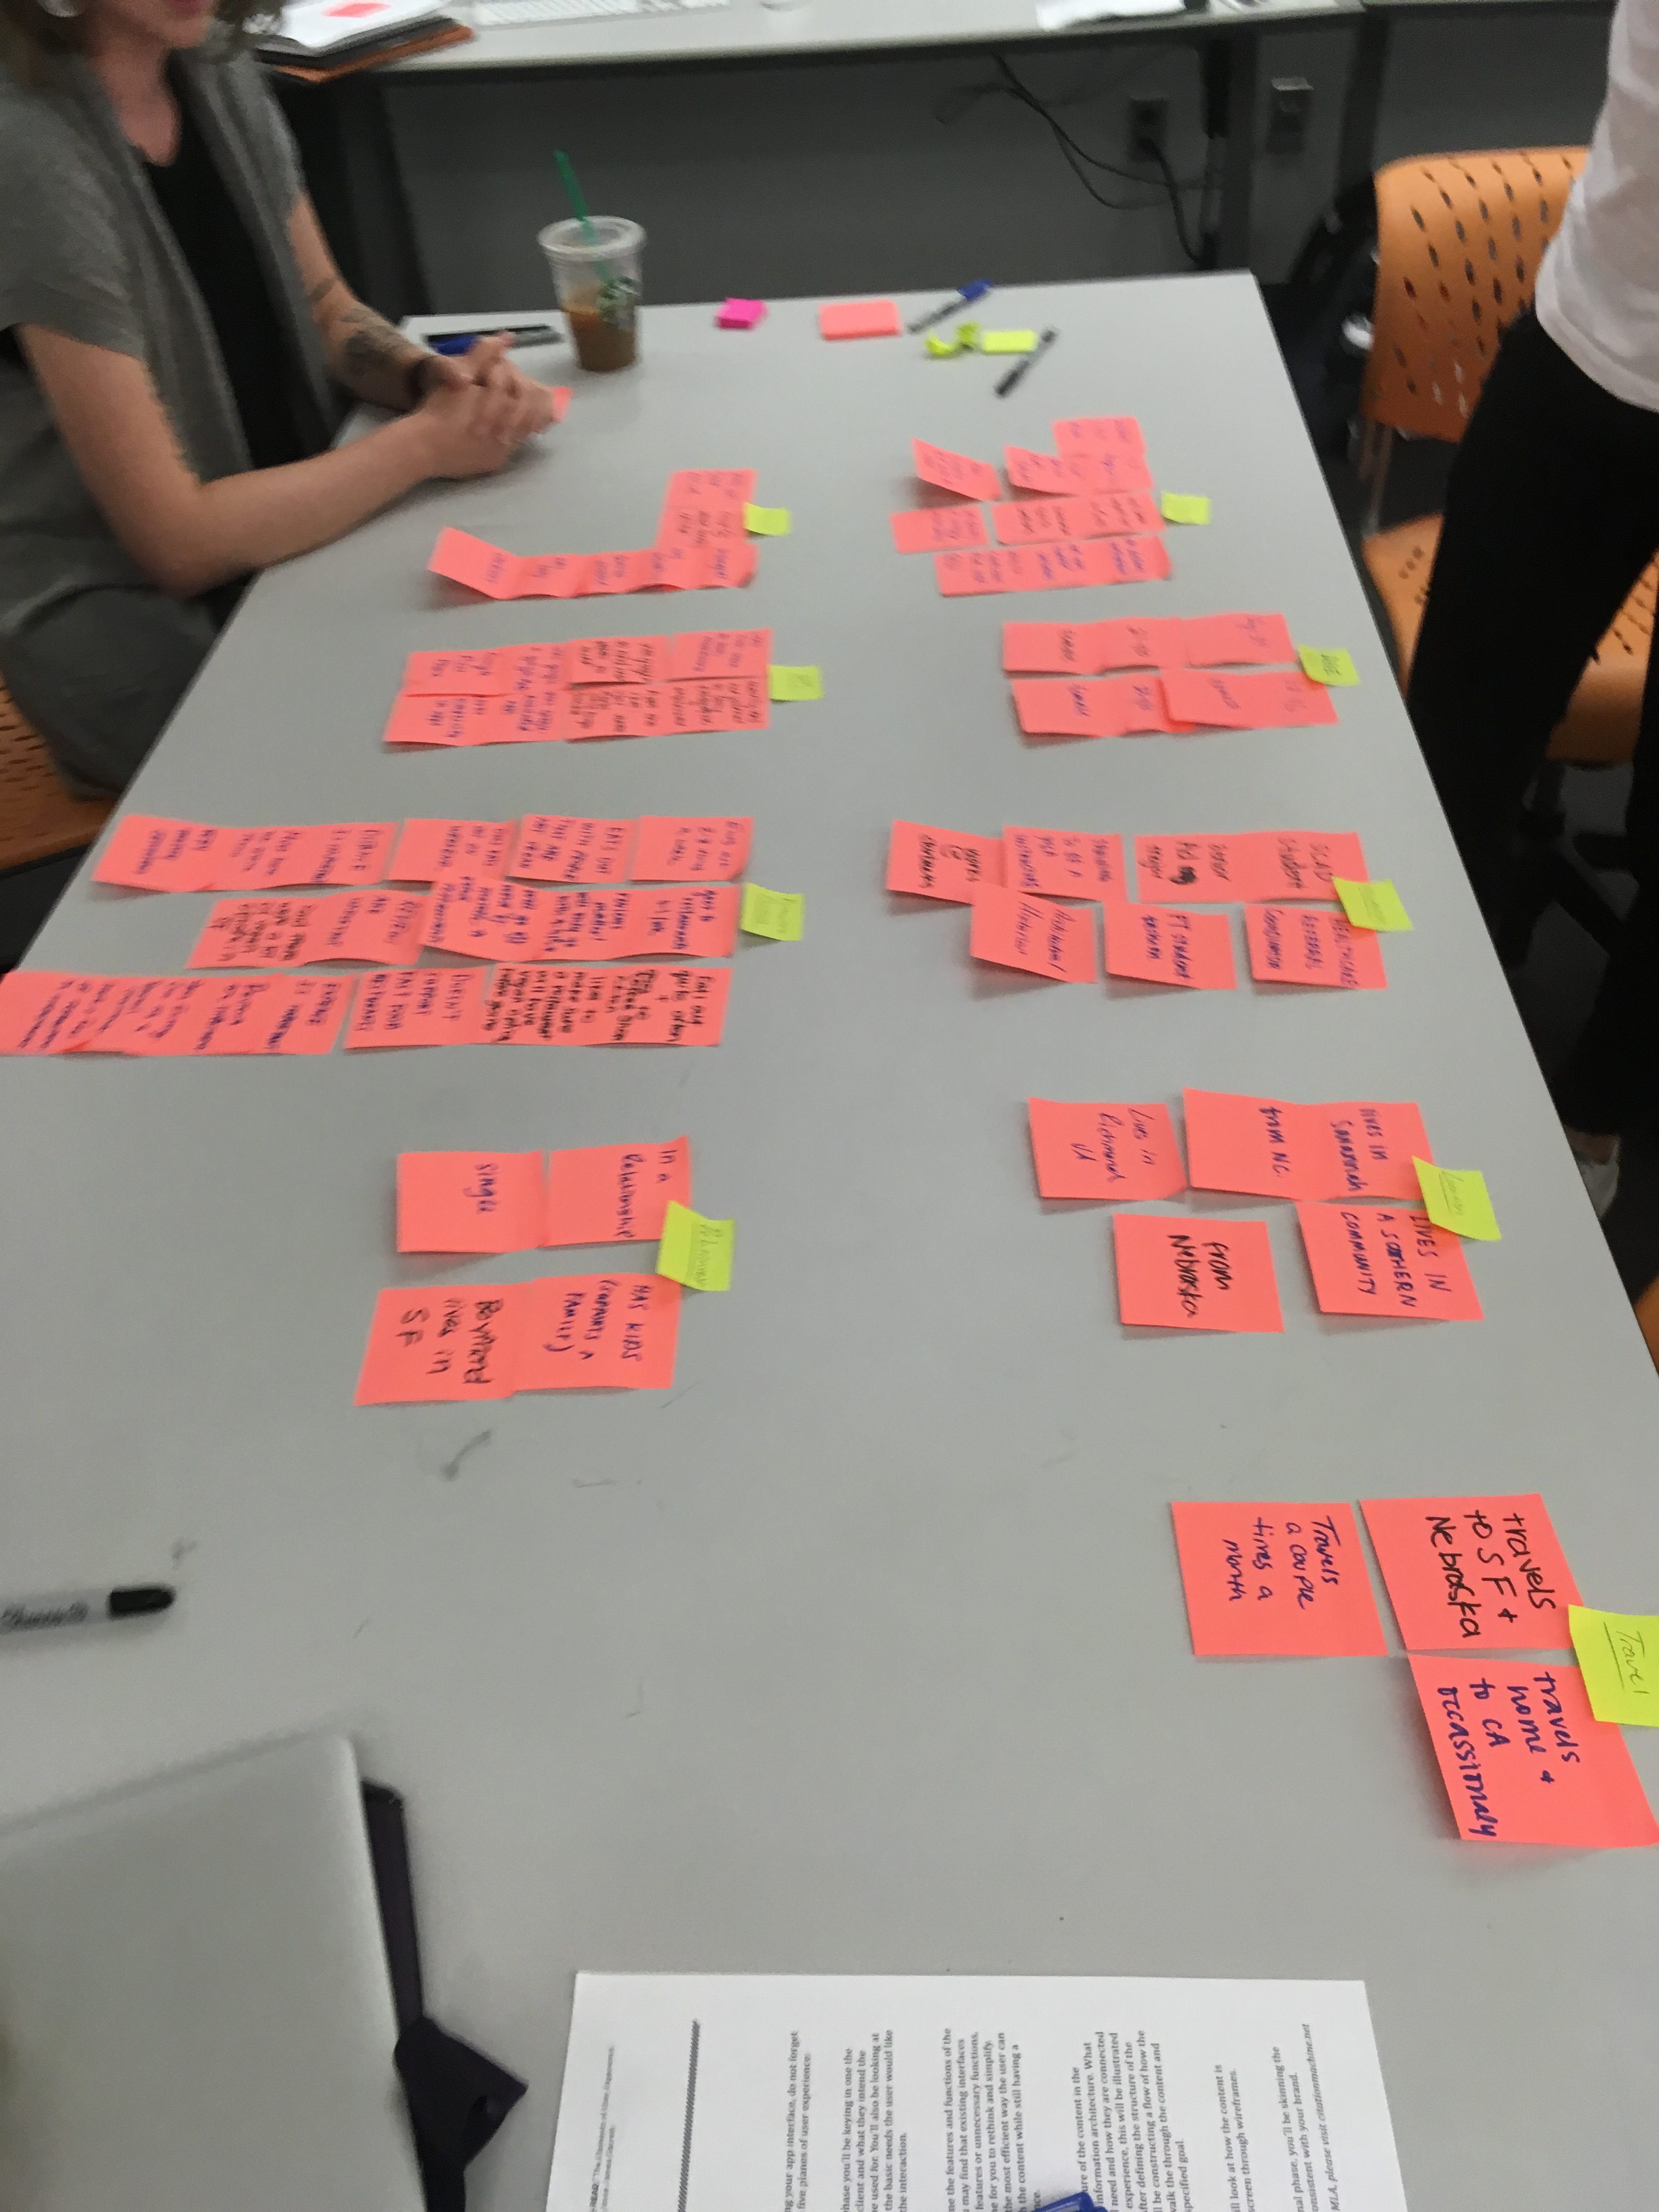
After creating a bank of data points, groups created clusters. They put their post-its in groups that could belong to a similar category. By synthesising data into clusters that were contextually relevant to the information gathered, categories were created along an x-axis, and named on different colored post-its.
These clusters were re-evaluated and organised into a matrix into three categories — thinking, feeling and doing. The resulting clusters read like a table, so that each post-it (or data point) was connected to a thinking, feeling or doing action as well as one of the categories that they came up with as a group.
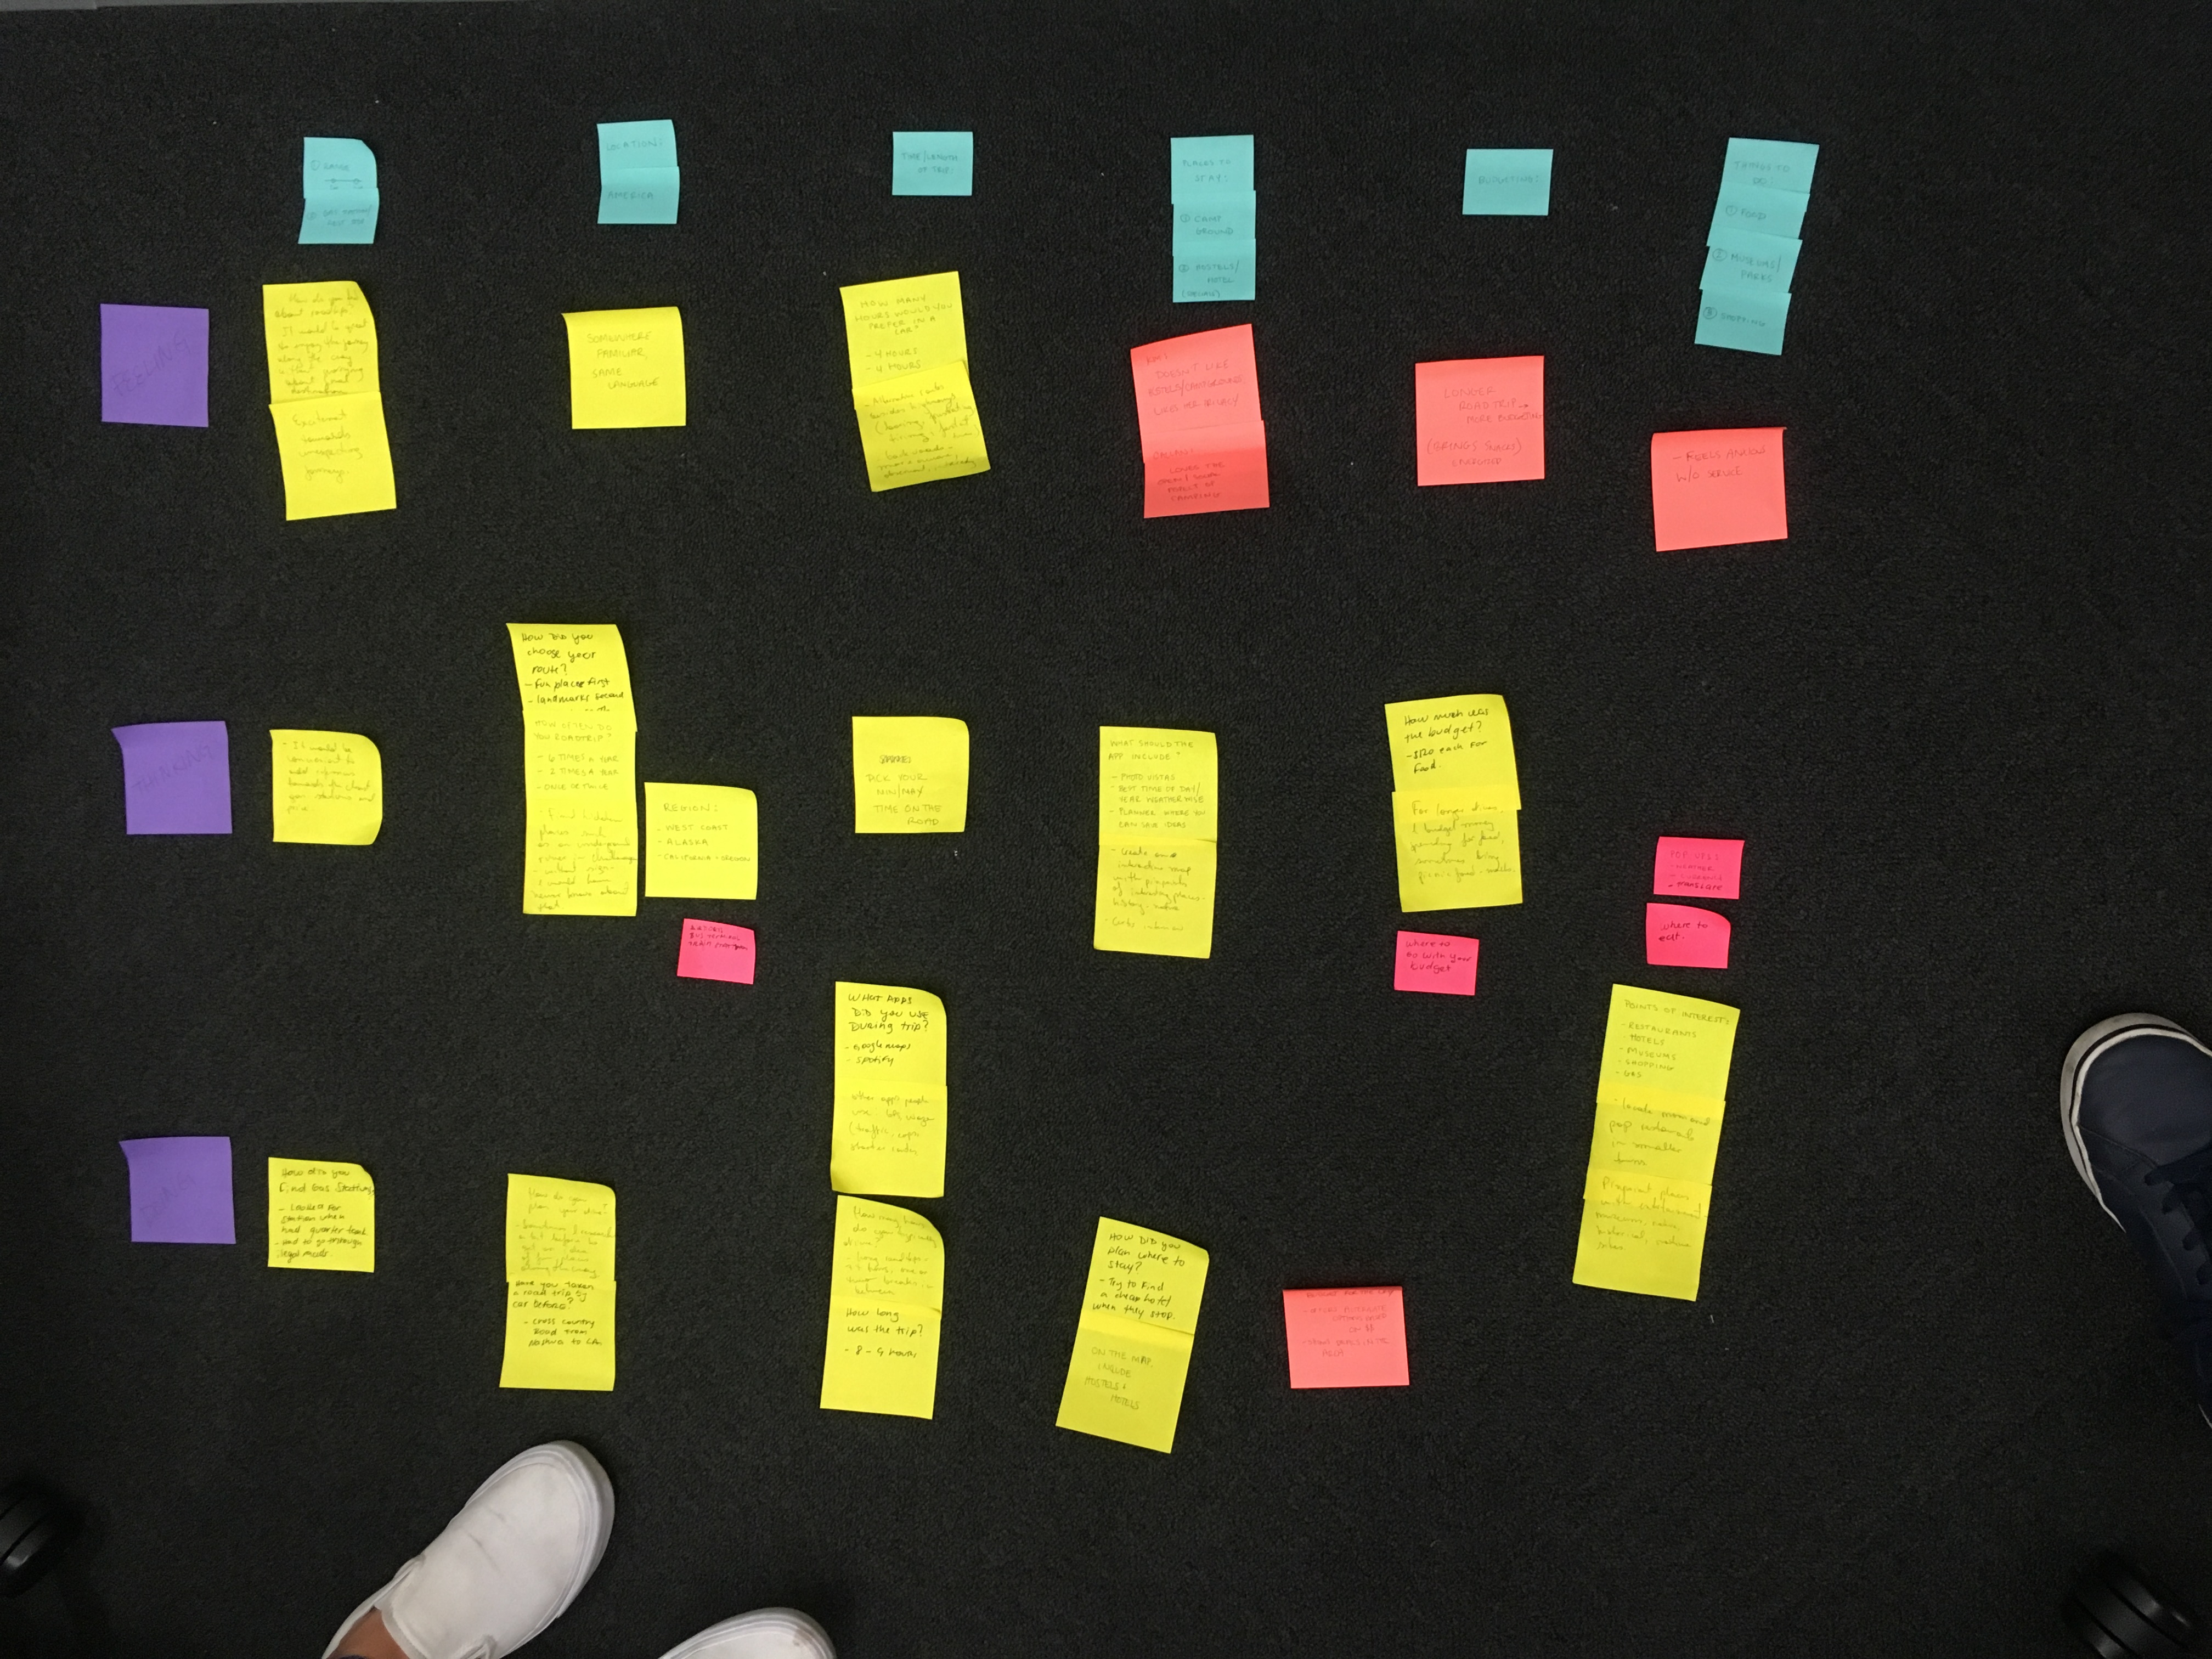
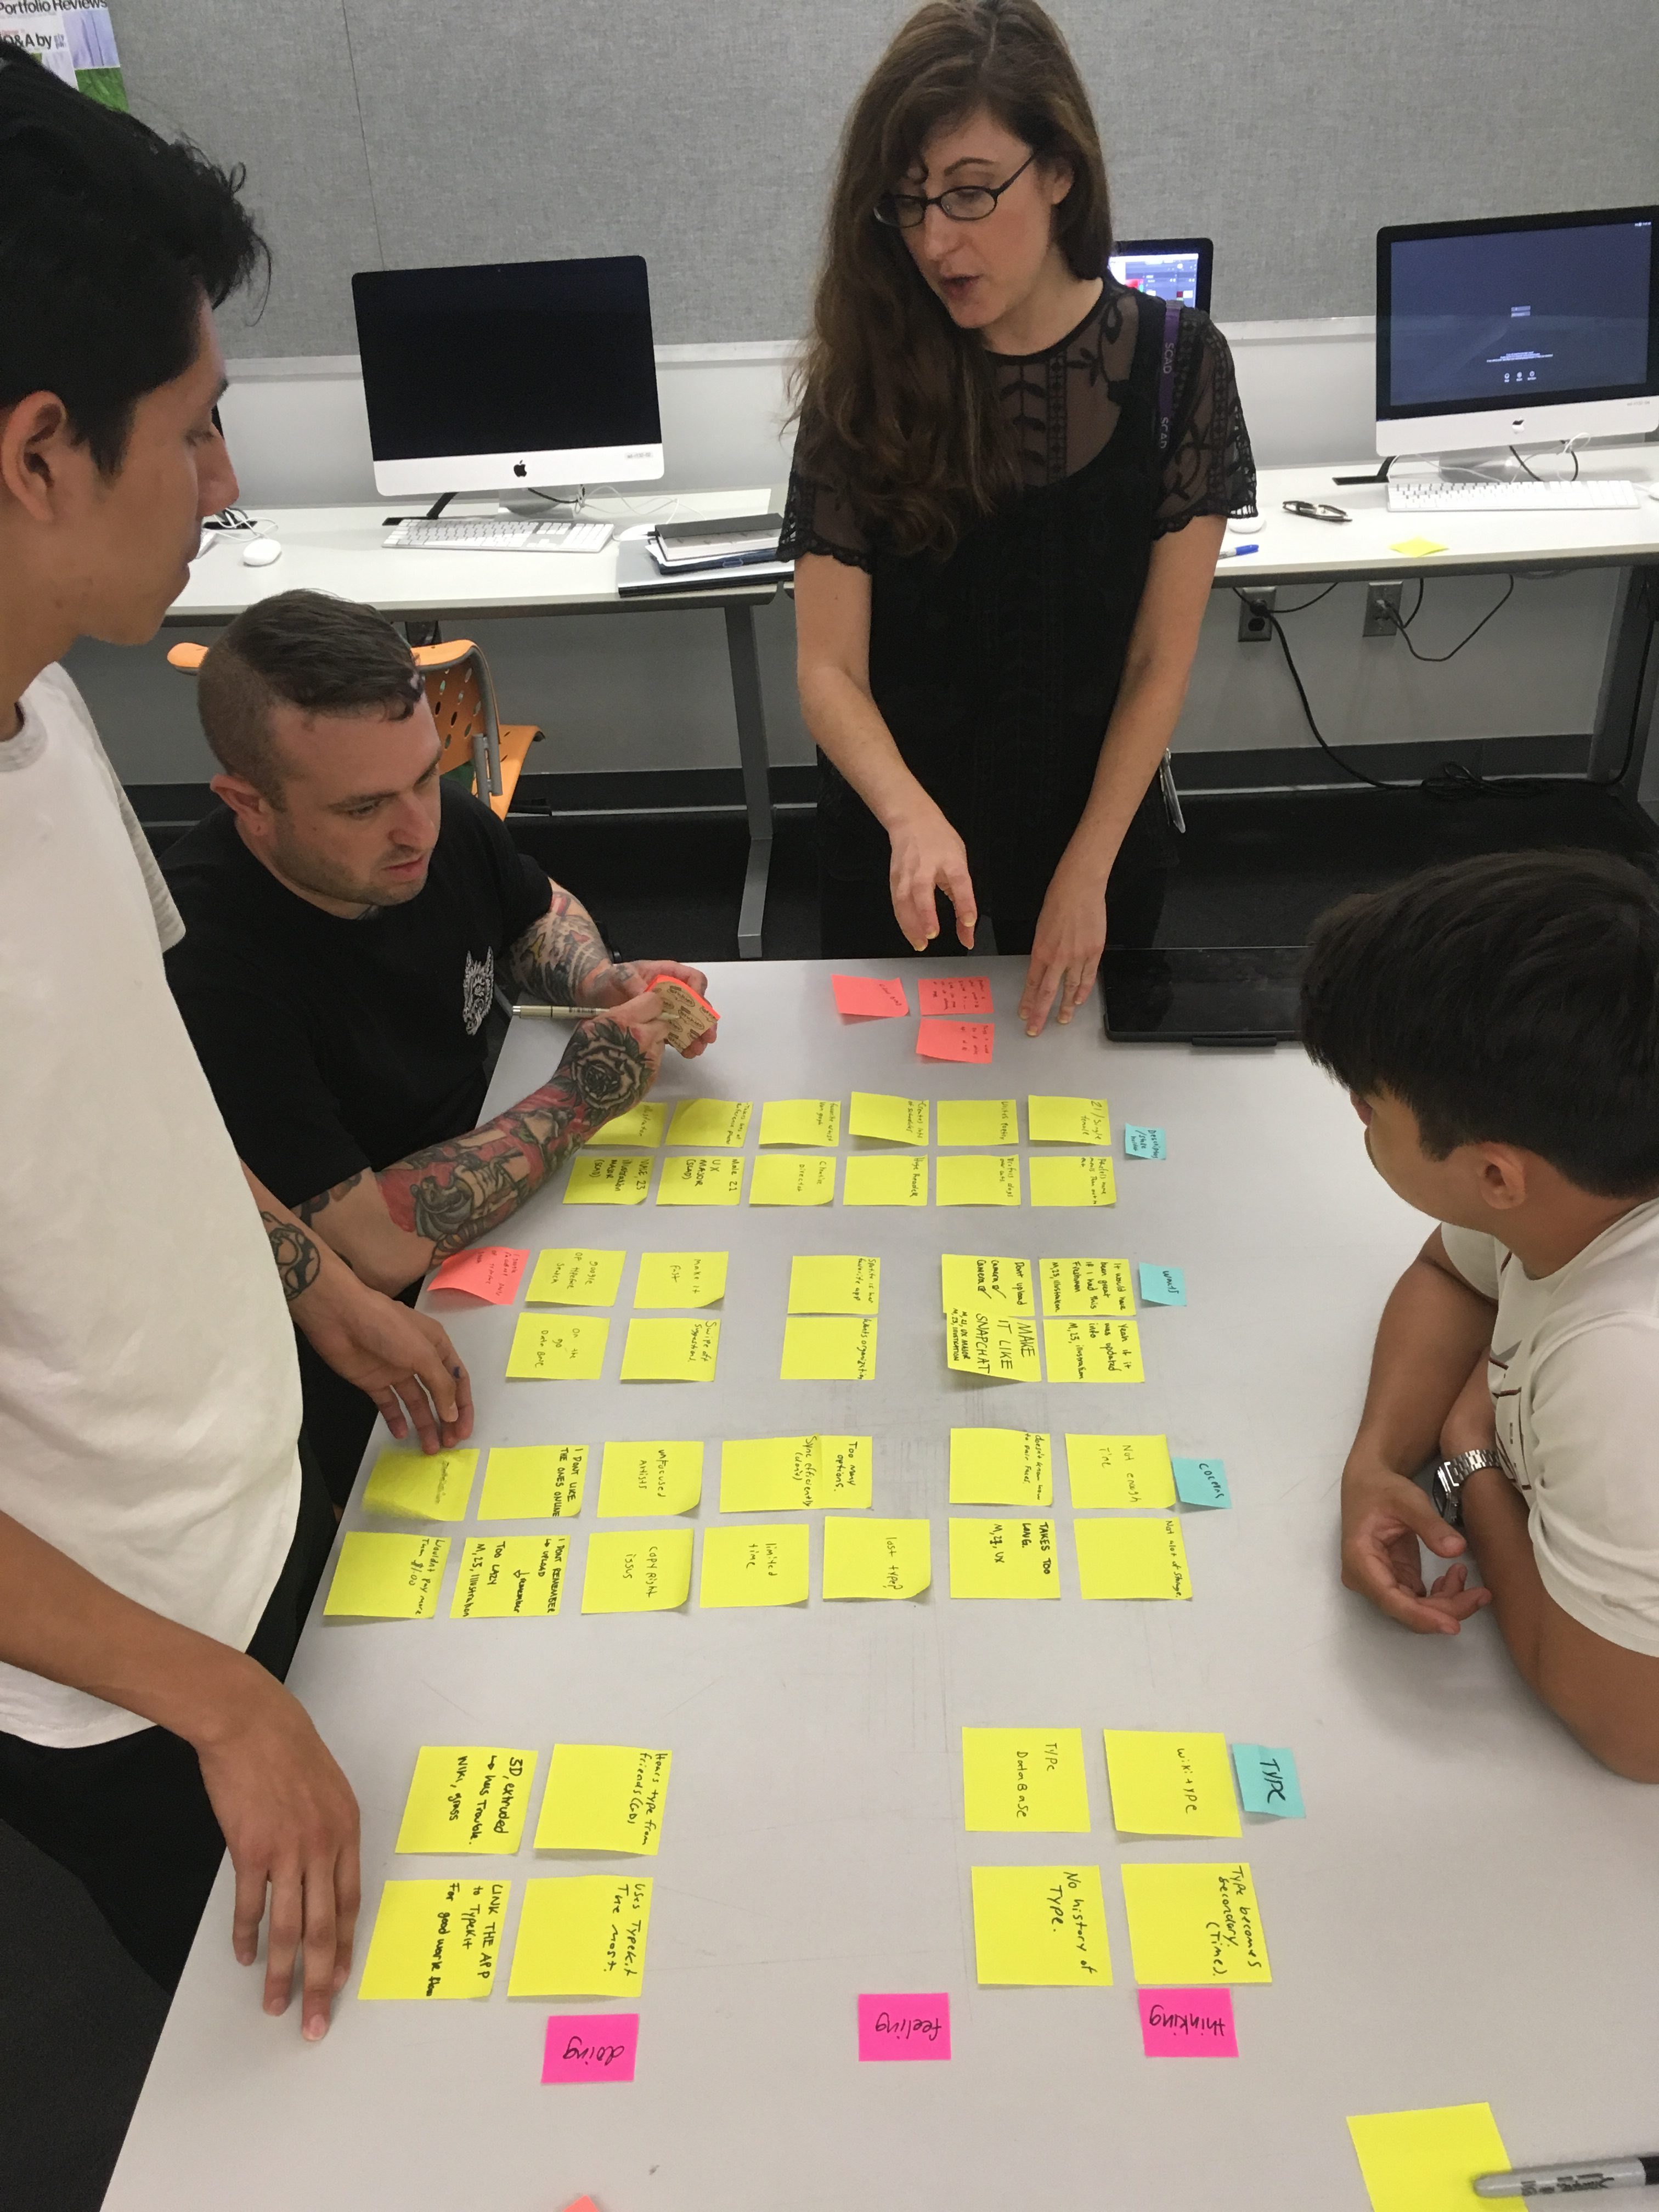
As soon as these were reorganised into the table with categories along the x-axis and thinking, feeling, doing along the y-axis, groups noticed that there were missing gaps in their table with fewer post-its in certain areas. This became their pain points, and regions for opportunity areas.
Using the opportunity areas as ideas for potential features that their app could have, each member of the group came out with a ‘How might we…’ statement, to express how their app could fulfil their user need.